


Back in March, QQQ reached a technical area we had been monitoring closely and presented the setup to our members. The ETF has since extended higher, gaining more than 26% and reaching new all-time highs. Now that the move has developed, it is worth going back to the original setup and reviewing what the Elliott Wave structure was showing at the time. Below, we walk through the daily chart and explain how the Blue Box helped define the potential entry and invalidation level.
QQQ Elliott Wave Daily Chart — 03.22, 2026
At the time, QQQ was correcting from its previous peak in a Double Three pattern. Our analysis suggested that the correction was getting close to an important turning point rather than starting a larger bearish move. The decline reached the 580.13–545.14 area (Buying Zone), which was an important Equal Legs and Fibonacci zone. We marked this area as a Blue Box and expected buyers to appear.
The trade risk was clearly defined below the setup. The 1.618 Fibonacci extension at 545.14 was the invalidation level. After QQQ moved higher and recovered 50% of the decline from the blue (X) peak, the stop could be moved to breakeven, making the trade risk-free.
The same framework can be applied to other corrective structures. Our methodology for identifying 3, 7, or 11 swing patterns and Equal Legs, including how we define the entry and invalidation levels, is covered in detail in our educational video.
Quick reminder on how to trade our charts :
Red bearish stamp+ blue box = Selling Setup
Green bullish stamp+ blue box = Buying Setup
Charts with Black stamps are not tradable.
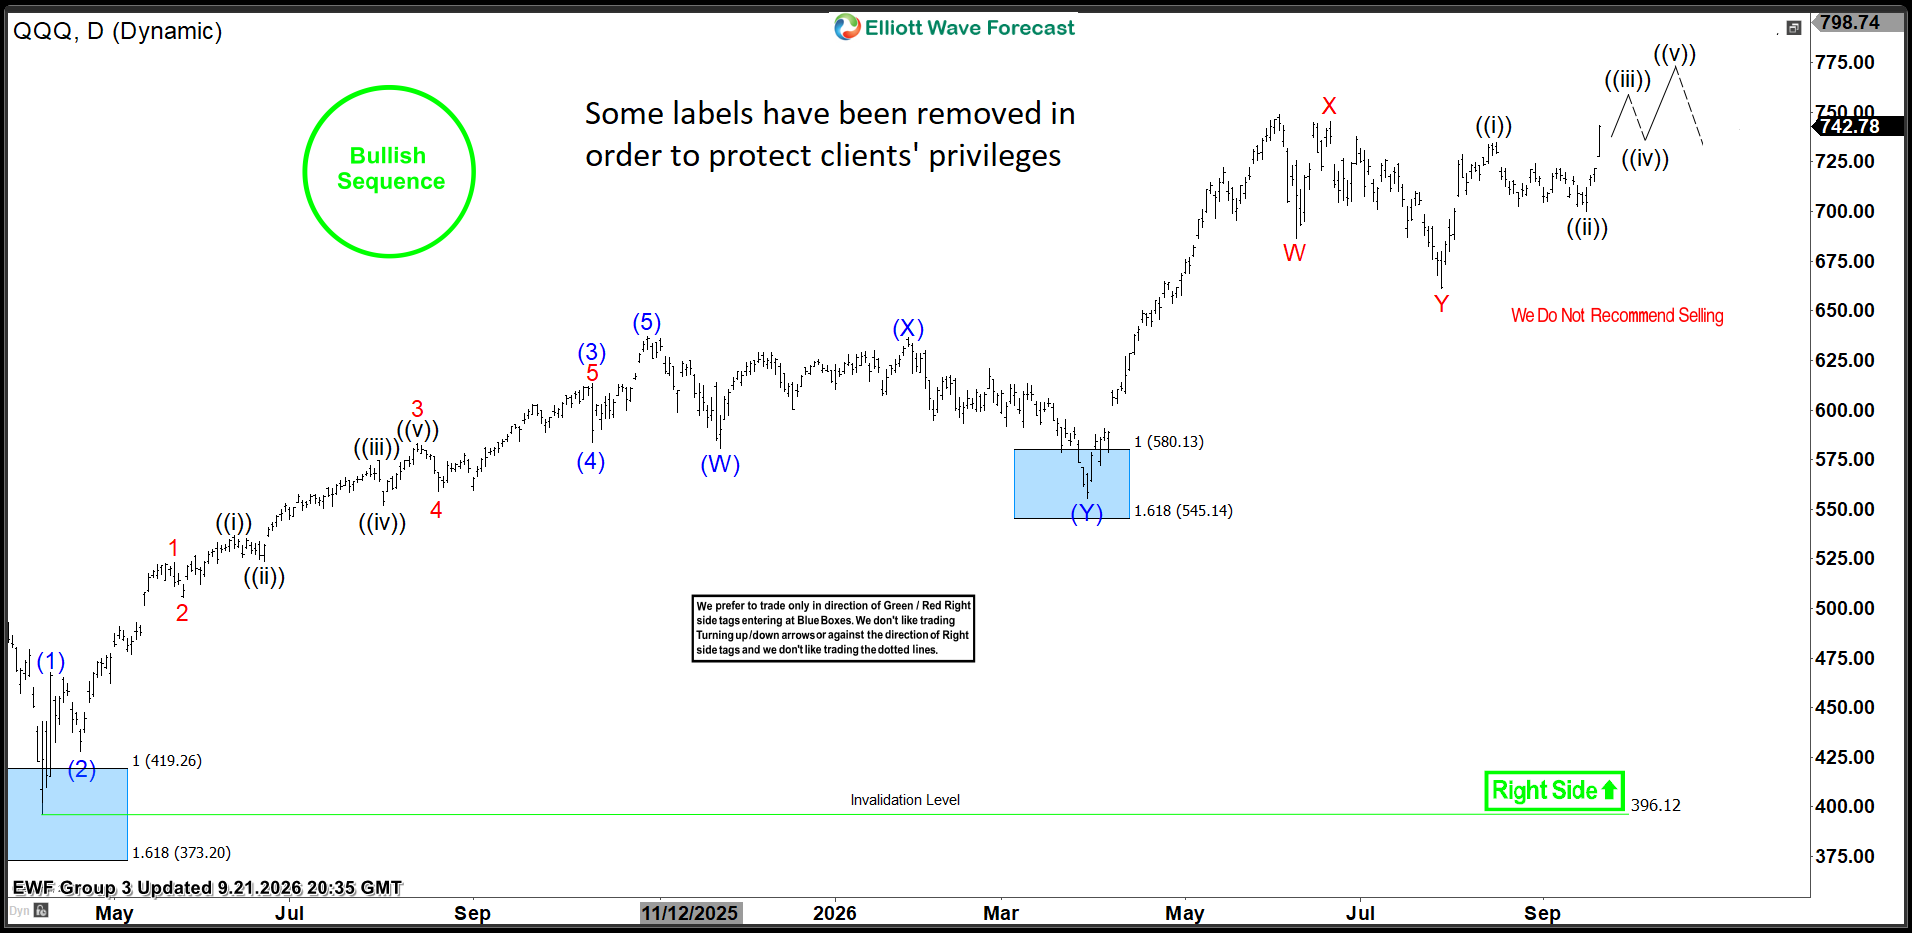
QQQ Elliott Wave Daily Chart — 09.21. 2026
QQQ completed the correction inside our Blue Box buying zone, where buyers stepped in as expected. The ETF then turned higher and continued to rally, reaching new all-time highs. In less than six months, the move resulted in a gain of approximately 26%.
This type of market analysis can be useful across different trading styles and time horizons. Active traders can use our intraday and short-term setups to monitor potential opportunities throughout the trading week. Swing traders can focus on larger corrective structures and key technical levels, while longer-term investors can use the analysis to identify areas where a market may offer a more attractive entry after a significant correction.
The goal is not to predict every market move, but to provide a structured view of price action, important technical levels, and potential risk areas. This allows each trader or investor to apply the analysis according to their own strategy, timeframe, and risk management.



Comments
Log in or sign up to join the conversation.