


Autodesk Inc. (Nasdaq: ADSK) maintains a bullish long-term Elliott Wave outlook despite the ongoing corrective price action. The monthly chart suggests that ADSK completed a major impulsive advance in wave (I) near the 2021 highs and is currently developing a larger corrective structure in wave (II). Once this correction completes, the stock could resume its broader bullish trend.
Autodesk Elliott Wave Analysis: Corrective Structure
The monthly chart shows that Autodesk completed a significant five-wave advance from the 2009 low at $11.70, eventually reaching the wave (I) peak in 2021. Since then, the stock has been developing a corrective structure labeled a-b-c within the larger wave (II). Wave a completed following the initial decline from the 2021 peak, while wave b represents the subsequent recovery toward the 2025 highs. The current Elliott Wave interpretation suggests that wave c could develop lower before completing the larger corrective sequence.
Corrections commonly unfold in three, seven, or eleven swings. Therefore, the anticipated decline should be viewed within the context of the broader bullish structure rather than as confirmation of a long-term bearish reversal.
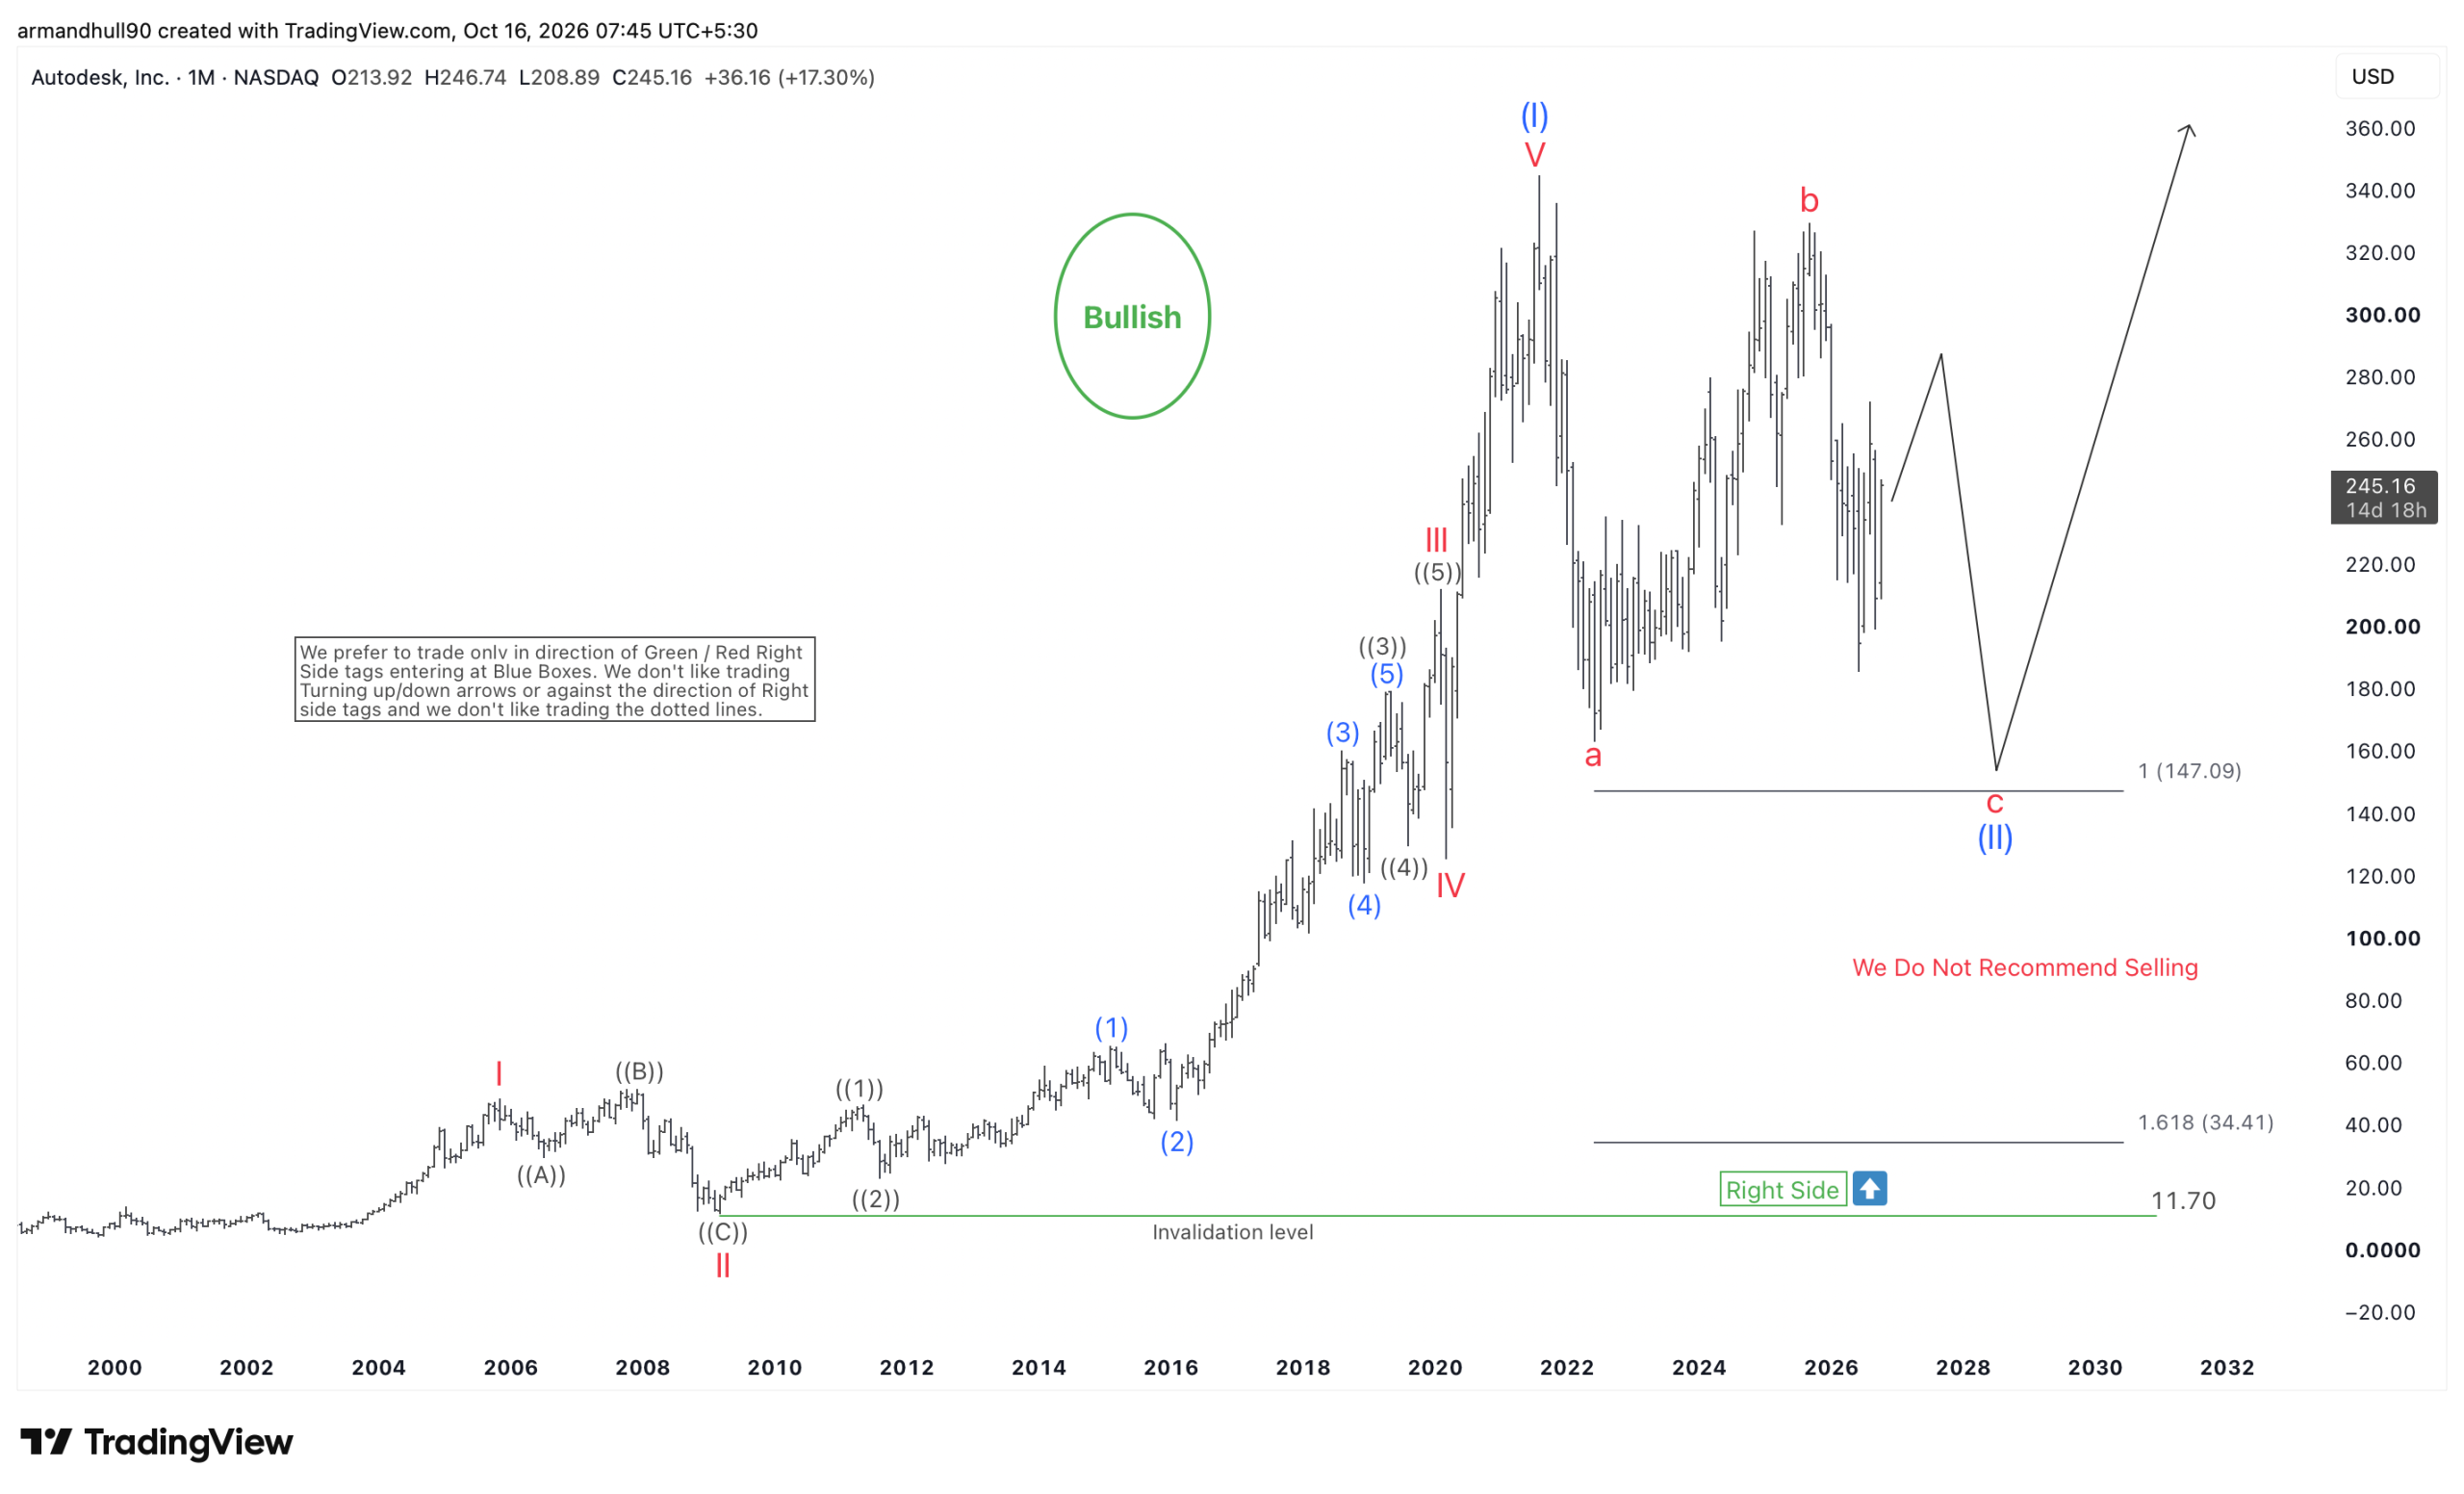
ADSK Stock Forecast: Key Support at $147.09
The preferred Elliott Wave outlook suggests that Autodesk could extend its corrective decline toward $147.09, representing the 100% Fibonacci extension of wave a measured from wave b. This area could attract buyers and potentially mark the completion of wave (II). A deeper correction remains possible, although the larger bullish structure continues to favor an eventual recovery.
The chart identifies $11.70 as the long-term invalidation level, while the next Fibonacci extension target comes in near $34.41. However, reaching that level appears less likely at this stage, as it would require a significantly deeper pullback. Instead, we expect the correction to find support around the equal legs area, where buyers could re-emerge and resume the broader bullish trend.
What's Next for Autodesk?
Once wave (II) completes, ADSK could begin a new impulsive advance in wave (III), potentially challenging previous highs and extending toward the $360 region or higher.
Overall, our Autodesk Elliott Wave forecast remains bullish, with $147.09 representing the key area to monitor for potential buying opportunities. We prefer the bullish side after the corrective structure completes rather than selling against the larger trend.



Comments
Log in or sign up to join the conversation.