


Assurant Inc. (AIZ) is currently approaching a critical support zone, signaling the potential conclusion of a two-month bearish correction. As the stock tests this key level, it appears poised to resume its primary long-term bullish trend.
About AIZ
Assurant Inc. is a leading global provider of risk management and insurance solutions, serving the housing and lifestyle markets. Headquartered in Atlanta, it operates across Global Housing and Global Lifestyle segments, offering products such as mobile device protection, vehicle service contracts, and renters insurance. With operations in over 20 countries, Assurant partners with major financial institutions and retailers, leveraging data-driven innovation to deliver consistent growth and strong shareholder value.
AIZ Long-Term Elliott Wave Analysis – Weekly Chart
The all-time bullish cycle for AIZ began in November 2008 at $12.52. From that low, wave (I) advanced in a clear impulse and peaked in February 2020 at $146.21. It was followed by a sharp correction – wave (II). Wave (II) ended in March 2020 at $76.26. From there, wave (III) is expected to extend higher, with an overall target between $287 and $417. Between March 2020 and April 2022, price completed another impulse wave structure which we can identify as wave I of (III). After that, a 7-swing pullback followed for wave ((II)), which ended in March 2023.
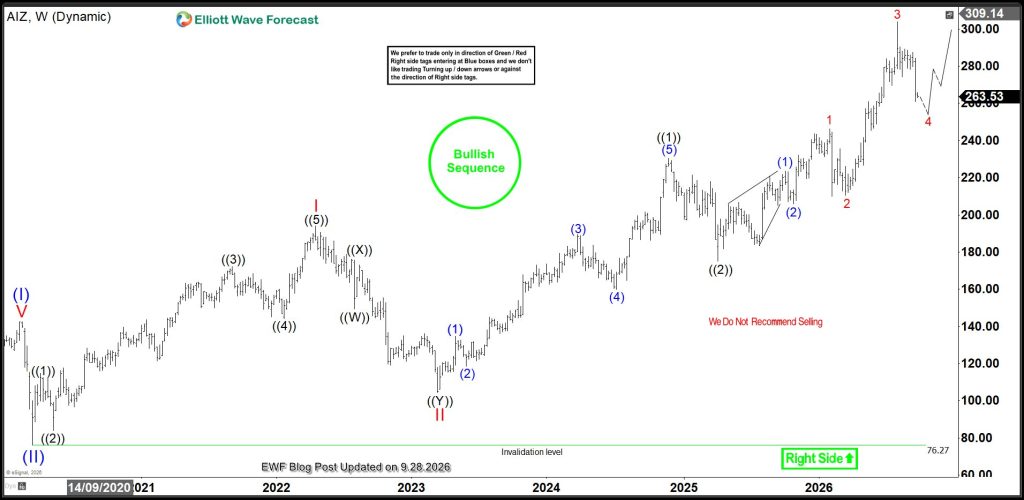
Following the March 2023 lows, wave III commenced, completing a clear five-swing impulse structure for wave ((1)) of III in November 2024. This was followed by a seven-swing pullback for wave ((2)) of III, which concluded in April 2025. As shown on the weekly chart, wave ((3)) is currently in progress. Based on Fibonacci technical projections, wave ((3)) could advance toward the $331–$379 range, pointing to a broader wave (III) cycle target of $417. These projections indicate significant bullish potential, suggesting that investors and traders should continue to buy the dips, as every bearish cycle presents a new opportunity for a trade.
AIZ Long-Term Elliott Wave Analysis – Daily Chart
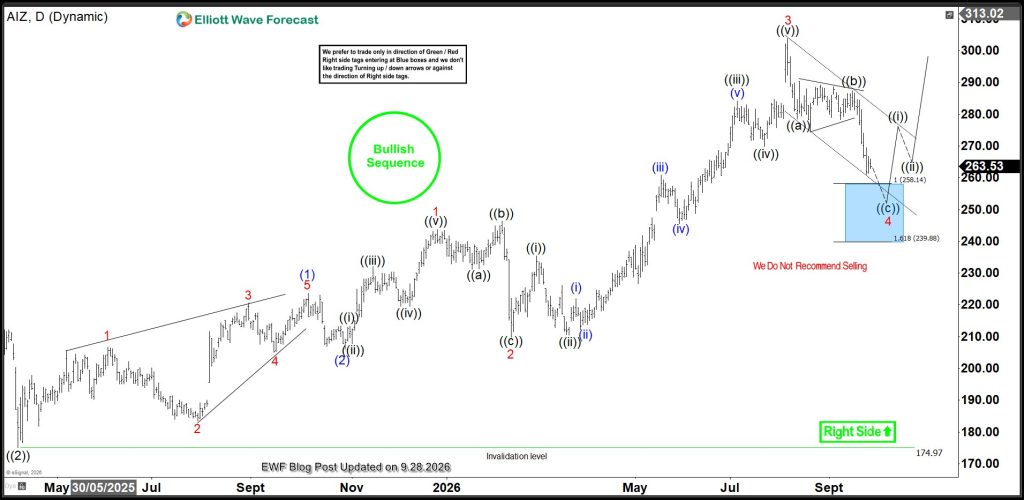
The stock has entered a pullback phase after peaking at $303.90 in August 2026. As illustrated on the daily chart, this decline is unfolding as a simple zigzag structure. Wave ((a)) of 4 completed an impulse, followed by a sideways triangle for the wave ((b)) connector. Currently, wave ((c)) is developing as an impulse to finalize wave 4. We identify the 258.14–239.88 range as a blue box support zone where wave 4 can conclude. From this zone, the stage will be set for wave 5 of (3). Should the stock respect this support, we anticipate a recovery that pushes prices above the $300 level, targeting the $320–$330 range.
Following the completion of wave 5 of (3), a wave (4) pullback is expected to initiate a new bearish cycle. Once this correction reaches its extreme, traders and investors can look for buying opportunities within the blue box support zone to capitalize on the subsequent trend.



Comments
Log in or sign up to join the conversation.