

Stocks are on the ledge of a VERY large cliff.
Image Source: Unsplash
Anytime the S&P 500 has taken out its 50-week moving average (WMA), it usually falls to the middle of its Bollinger Band, if not the 200-WMA. In chart terms below, anytime the S&P 500 takes out the red line, it drops to the blue dotted line if not the green line.
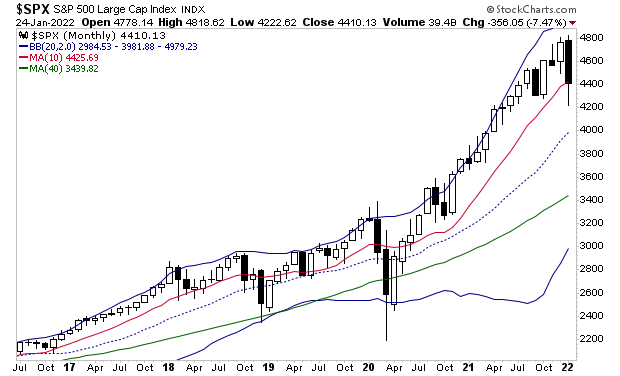
If stocks hold right here and now, then we have escaped a bear market by the skin of our teeth. If stocks DON’T hold right here and now, it’s a bear market and stocks will eventually drop another 10% if not 20%.
I’m talking about this:
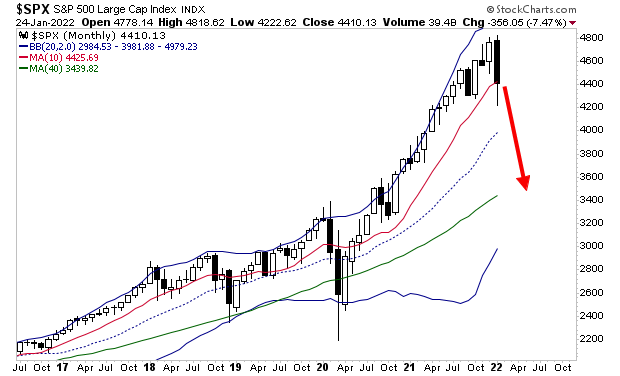
What happens right now is key. If stocks hold these gains, then this recent drop was likely just a plain vanilla sell-off to take out the excess froth in the markets.
However, if, instead of holding those gains, stocks roll over and begin falling again, then we are likely at the start of a more pronounced breakdown and possibly a new bear market.



Comments
Log in or sign up to join the conversation.