

This week, we'll look at a couple of pretty straightforward charts of Gold and Silver that represent lines in the sand for the secular bull market.
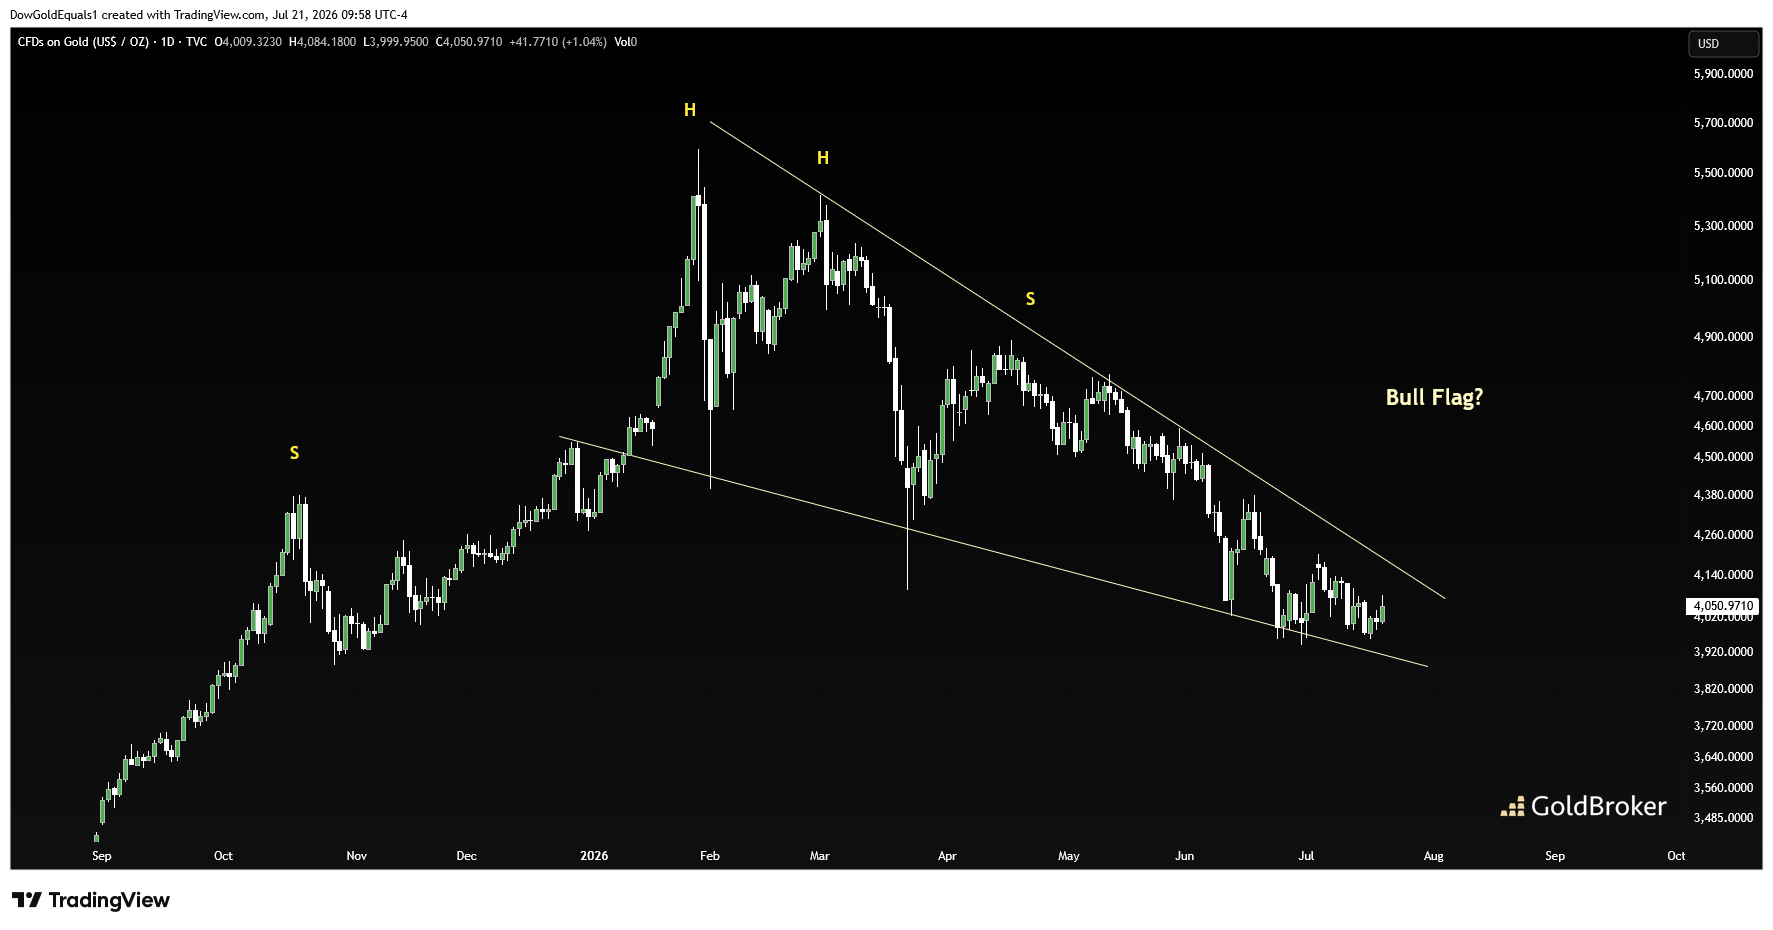
Starting with Gold, we see precisely why it is so difficult to ride a big bull market to its completion. On the one hand, there appears to be a large potential Head & Shoulders topping pattern coming together that some analysts believe could spell the beginning of the end of Gold's 26-year secular bull market. On the other hand, we also see a pretty convincing bull flag coiling toward its apex that could ultimately lead to Gold's next big leg higher. So what's an investor to do?
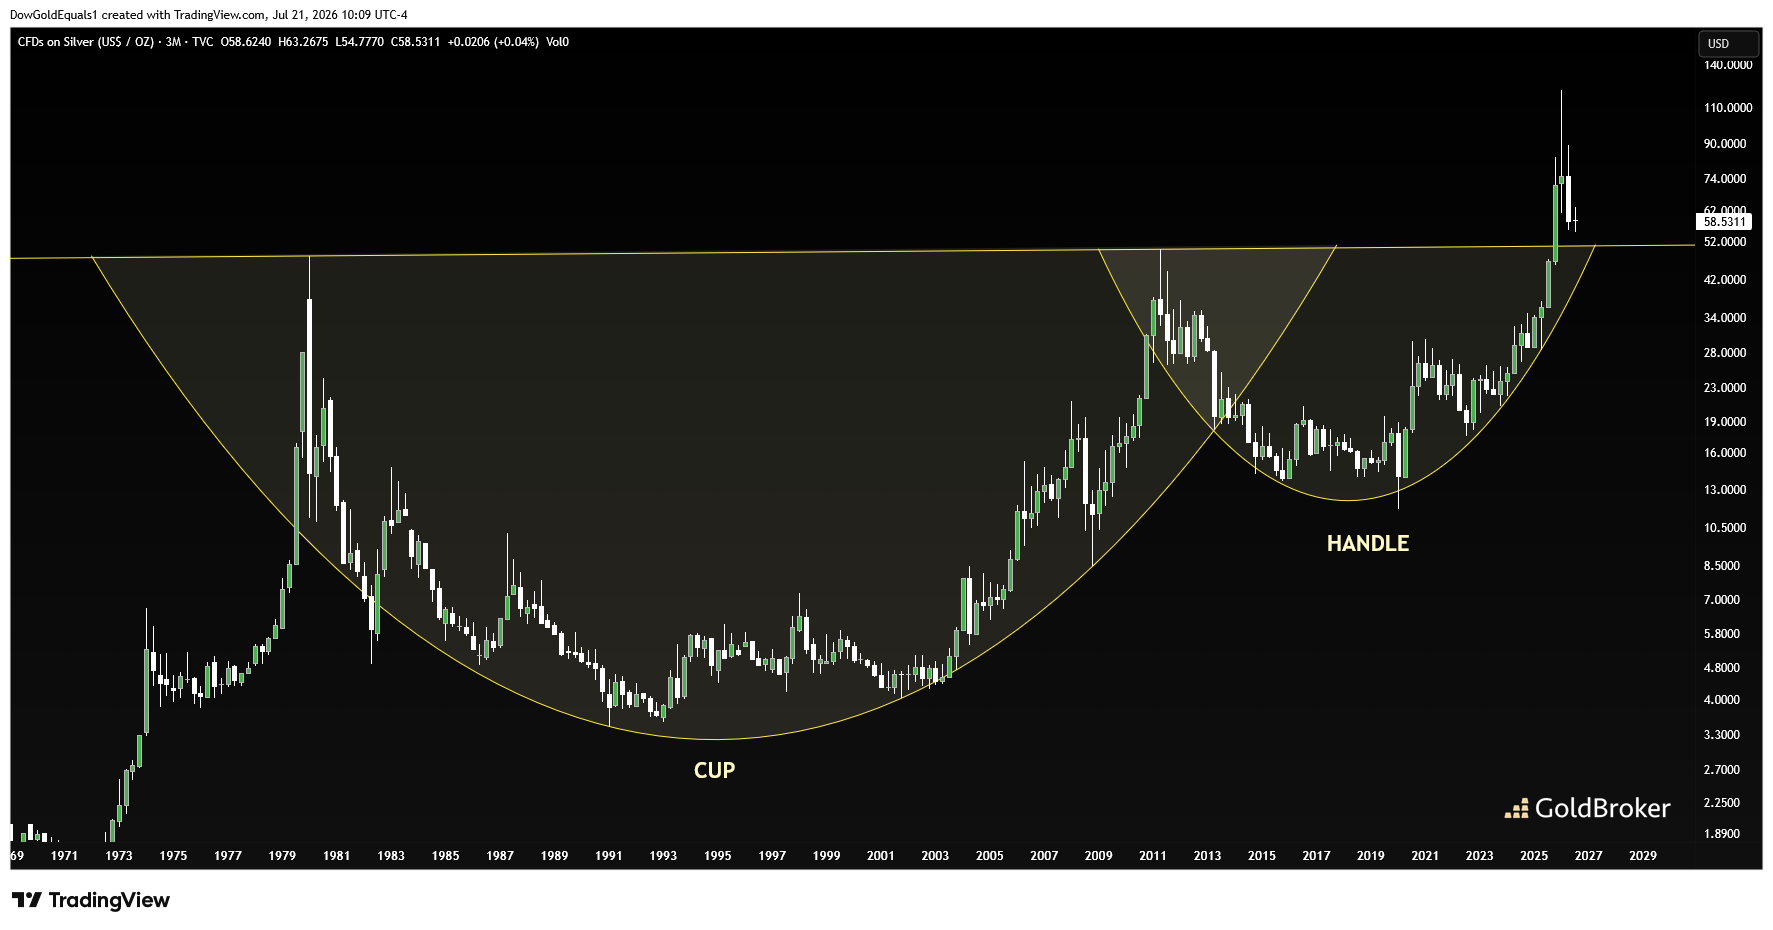
For clues, we'll take a look at Silver and its 45-year Cup & Handle pattern. For me, the precious metals bull market is very much alive so long as this pattern holds. Currently, price is looking to backtest the neckline at around $50. A backtest and impulsive move higher would represent extremely healthy bull market action, and this outcome remains my base case.
For that reason, I put much more weight on a Gold bull flag than a head & shoulders.
Experience tells me that the bigger the pattern, the more likely it is to complete. Silver's cup & handle is the largest technical pattern I have ever seen.



Comments
Log in or sign up to join the conversation.