


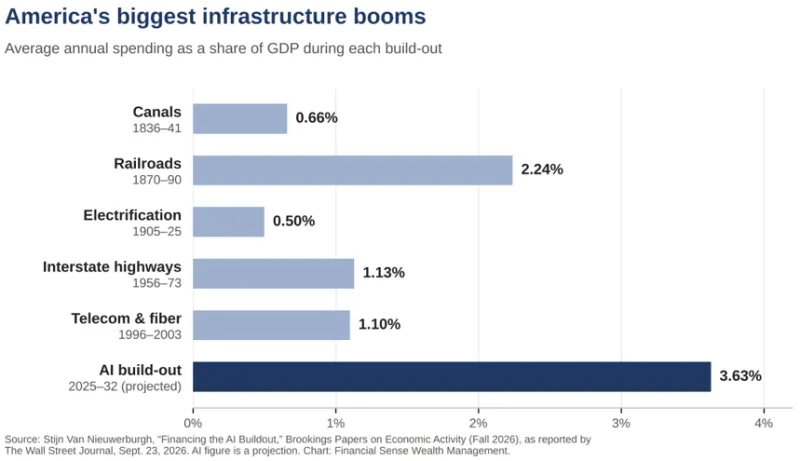
Artificial intelligence dominates the headlines. The Wall Street Journal recently called the AI build-out “the biggest economic bet in U.S. history,” citing estimates that spending on data centers and related infrastructure could reach $10.3 trillion between 2025 and 2032. At about 3.6% of GDP a year, that would exceed what the country spent, relative to the size of its economy, on canals, railroads, or the electric grid. The five largest cloud and AI companies alone are expected to spend more than $4 trillion on capital projects over the next four years, with a growing share financed through borrowing. Is this a technological revolution or an investment bubble?
Our view is that it is both. We believe AI will be transformative, but we also believe the investment boom surrounding it has become a bubble that may burst sooner than most analysts expect. History shows that technology can change the world while the companies financing it lose money. That happened with railroads in the 1800s and fiber-optic networks in the late 1990s: builders spent ahead of demand, borrowed heavily, and found that returns arrived too slowly to cover their debts.
We see two pressures that could bring the turning point forward. First, the industry has committed to spending far more than AI companies currently earn, relying on revenue growth that has yet to materialize. Second, Chinese open-source AI models perform close to leading American models at a fraction of the cost, and many are free to download. That competition makes premium pricing harder to sustain and threatens the margins needed to justify the spending. As Louis Gave of Gavekal Research has said, “When China enters a room, profits walk out.”
We believe this boom is unlikely to escape the busts that have followed earlier investment cycles. In this letter, we examine what a downturn could mean for the economy, financial markets, and your portfolio. We also explain how we are positioning client portfolios to protect what you have built while remaining ready for opportunities a reset could create.
The Scale of the AI Investment Boom
The Wall Street Journal article cited research by Stijn Van Nieuwerburgh of the Brookings Institution (click for link). The research compares the AI infrastructure build-out with investment booms over the past two hundred years. As the figure below shows, the current boom could become the largest in U.S. history.
The scale of this investment is remarkable, but so is its concentration. While money pours into data centers, investment in other areas of the U.S. economy has weakened. Rather than accompanying a broad revival in domestic construction and manufacturing, the AI boom is increasingly carrying construction growth on its own. In our view, the administration’s tariff policies are contributing to that imbalance by discouraging the very investment needed to reindustrialize the country.
President Trump’s stated goals—bringing manufacturing home and reducing dependence on foreign suppliers—have merit. COVID exposed the economy’s vulnerability to supply-chain disruptions, and the U.S. shale boom demonstrated the benefits of greater domestic capacity. Reduced reliance on foreign energy helped the U.S. weather the energy shocks from the 2022 Russia–Ukraine war and the current Iran war better than its Asian and European counterparts.
The problem lies in how the administration is pursuing those goals. Building a factory requires long-term commitments, yet unpredictable, on-again, off-again tariffs make it difficult for executives to estimate input costs or expected returns. Tariffs also raise the cost of imported equipment and materials that businesses may need to expand U.S. production. Instead of encouraging companies to build, this uncertainty gives them reason to postpone investment. In our view, subsidies and tax breaks that lower domestic production costs would better support reindustrialization than tariffs that raise costs for U.S. businesses and consumers.
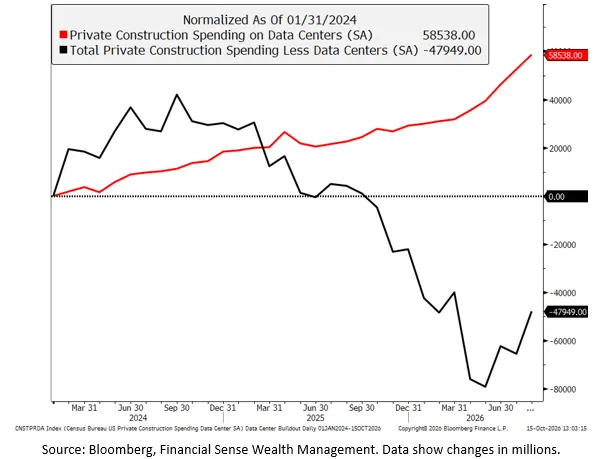
The chart below illustrates the widening gap. Total U.S. private construction spending excluding data centers grew throughout 2023–2024, began to stall in early 2025, and subsequently turned negative following the introduction of Trump’s tariff policies. Data center construction has continued to expand, while the rest of private construction is now subtracting from economic growth.
That leaves the economy increasingly dependent on a single investment boom. The concern is therefore twofold: tariff uncertainty is undermining a broader revival in U.S. production, while data centers are providing the construction growth that other industries are failing to deliver. This makes the durability of the AI boom especially important.
How much is the AI boom actually contributing to economic growth, and what happens if it reverses? On the Grant Williams Podcast in early September, Gerard Minack of Minack Advisors argued that its economic impact is only a fraction of that of the 1990s technology, media, and telecom (TMT) bubble. His key distinction is that gross domestic product (GDP) measures domestic production, not total spending.
The Wall Street Journal figures describe spending. Much of that spending, however, goes overseas rather than circulating within the U.S. Building a data center adds to domestic production, but much of the equipment inside comes from South Korea and other Asian countries. In the GDP calculation, imports are subtracted to exclude foreign production from domestic spending. The headline investment totals therefore overstate the direct contribution to U.S. growth. Minack estimates that the AI boom added 0.20% to annual GDP growth over the four quarters through June 2026; our estimate of 0.22% is similar.
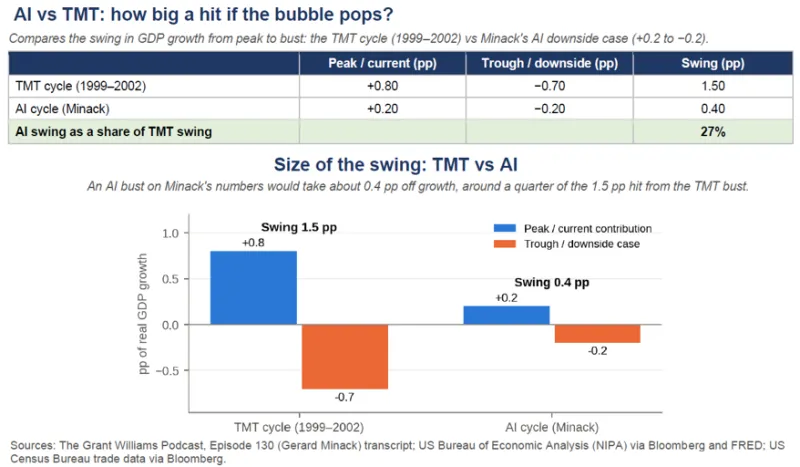
The TMT boom had a larger domestic impact because more of the spending on IT equipment and fiber-optic cables stayed within U.S. borders. Minack estimates that it added 0.80% to GDP growth at its peak and subtracted 0.70% at the trough of the bust. That 1.5% swing helped bring on the 2001 recession, delivering what he calls a “hammer blow.”
By comparison, he estimates that the AI boom’s current 0.20% contribution could become a 0.2% subtraction during a bust. The resulting 0.40% swing would be a “bump in the road” in his assessment.
Federal spending provides another way to put the AI boom in perspective. Since COVID, government outlays have played a much larger role in the economy. U.S. Treasury outlays over the trailing twelve months currently equal 22–24% of GDP. At the height of the 2008–2009 Great Financial Crisis (GFC), that share peaked at 24%. Before the GFC, the previous high was 23%, following the early 1980s double-dip recessions. The low was near 17% at the height of the TMT boom.
The U.S. is spending at levels associated with a major crisis, even without a comparable crisis today. Deficit spending is supporting strong nominal GDP growth. Relative to that fiscal support, the AI boom’s direct contribution to growth is modest, helping explain why Minack expects an eventual bust to be a bump in the road.
A Modest Economic Impact Could Mask Major Market Risks
The AI boom’s limited direct contribution to GDP does not mean a bust would be harmless to investors. Its financial impact could be substantial because technology accounts for such a large share of the stock market. To assess that exposure, we used Bloomberg data to compare market capitalization, earnings, and capital expenditures. As shown below, the technology sector plus Alphabet, Amazon, and Meta now accounts for a larger share of these S&P 500 measures than technology plus telecom and media did during the 2000 dot-com bubble.
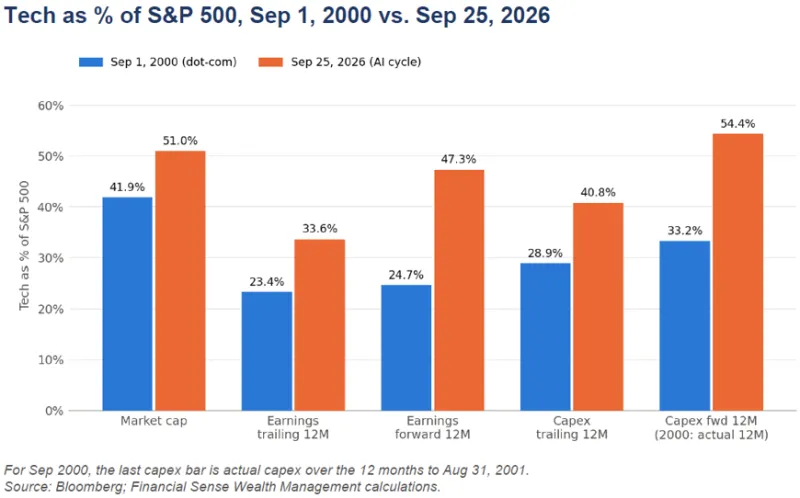
The technology sector and those three hyperscalers account for more than half of the S&P 500’s market value and nearly half of its earnings. That concentration makes the index especially sensitive to the AI investment cycle.
Ben Snider of Goldman Sachs estimates that just two companies, Micron and Nvidia, will account for a third of the entire S&P 500’s third-quarter earnings. Put another way, those two companies would generate more earnings than the bottom 490 companies combined. Although the index contains 500 companies, its trajectory is increasingly shaped by a small number of businesses, as the figure below illustrates.
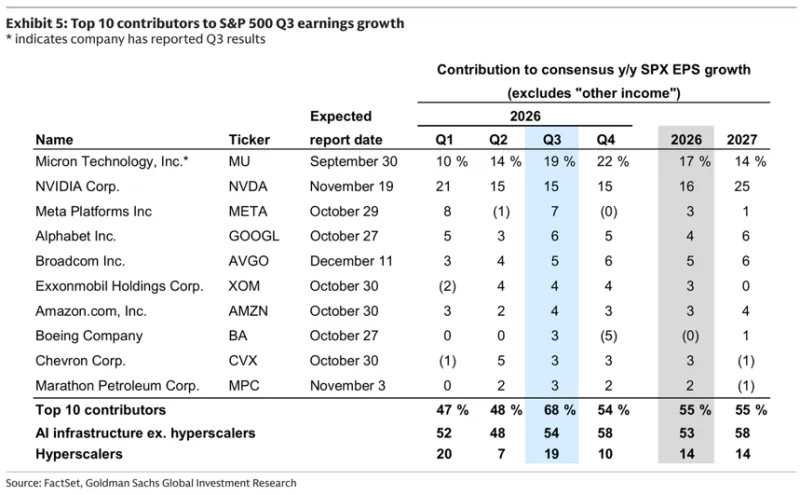
https://www.zerohedge.com/markets/sp-2-micron-and-nvidia-alone-will-deli...
Why Stocks Can Peak Before Spending Does
Goldman Sachs’ Bobby Molavi recently highlighted the “Two Peaks” phenomenon: stocks benefiting from a capital expenditure, or capex, boom often peak well before spending does. During the U.K. railway mania, equities peaked two years before capex. U.S. utility stocks peaked one year before spending during the 1920s electrification boom. Japanese equities peaked eighteen months before capex in the 1980s bubble, while TMT stocks peaked seven months before spending. The U.S. shale boom offers another example.
Stock prices reflect expectations about the future. Spending, by contrast, can continue under legally binding commitments and vendor-financing agreements even after investors turn cautious. The examples below show why waiting for a decline in capex to confirm a market peak can leave investors behind the curve.
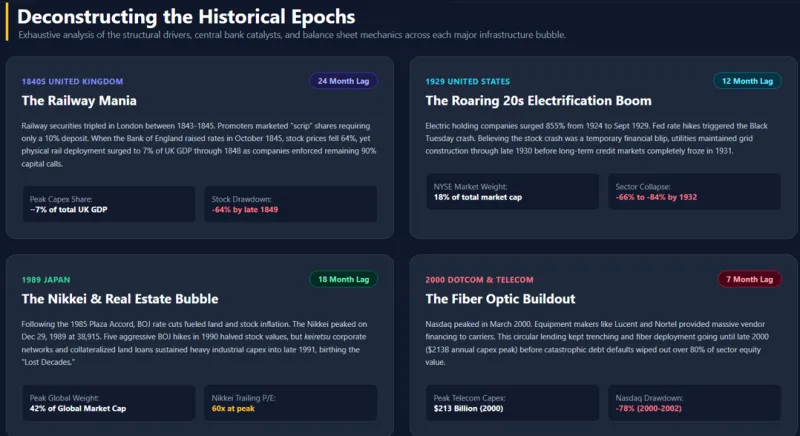
Source: https://gemini.google.com/share/f0b1245e986d?social_preview=false&skid=f...
In the historical bubbles illustrated above, tighter monetary policy constrained financing helped trigger the downturn. This time, we believe the catalyst could be AI revenue failing to keep pace with spending commitments, leading to defaults and eventually a collapse in capex.
On October 8, the Financial Times reported that OpenAI had told investors its annualized revenue was close to $50B at the end of September. That drew attention because figures circulating on Wall Street just weeks earlier had pointed to a $70B annualized rate. During the third quarter, we also saw a significant decline in the prices Anthropic and OpenAI could charge for tokens. The chart below tracks those prices in dollars per million tokens.
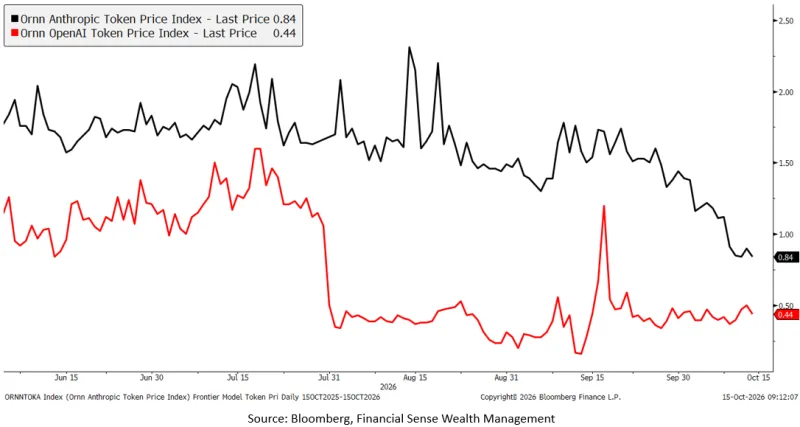
We believe competition from Chinese open-source models such as DeepSeek is a primary reason leading U.S. AI developers are losing pricing power. OpenRouter’s usage leaderboard illustrates that competitive pressure: U.S. models do not appear in the top 5.
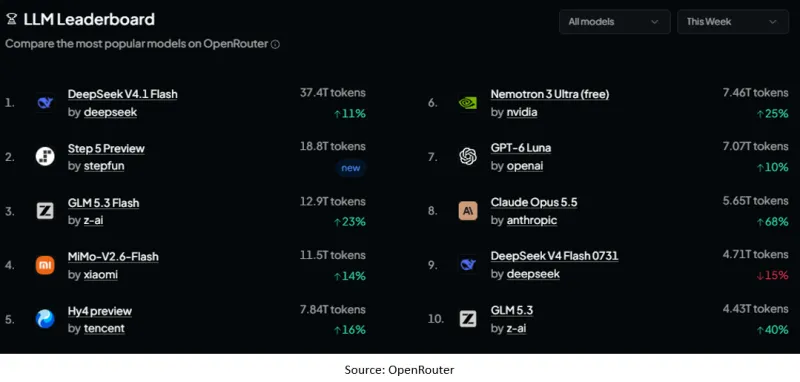
That competition raises questions about future revenue and valuations. OpenAI and Anthropic appear to be accelerating their IPO plans. Could their investors be anticipating a peak in the AI boom?
In mid-August, Polymarket placed the odds of Anthropic reaching a $2T valuation by year-end at 85%. Those odds now stand at 59%, having fallen alongside the company’s token pricing power.
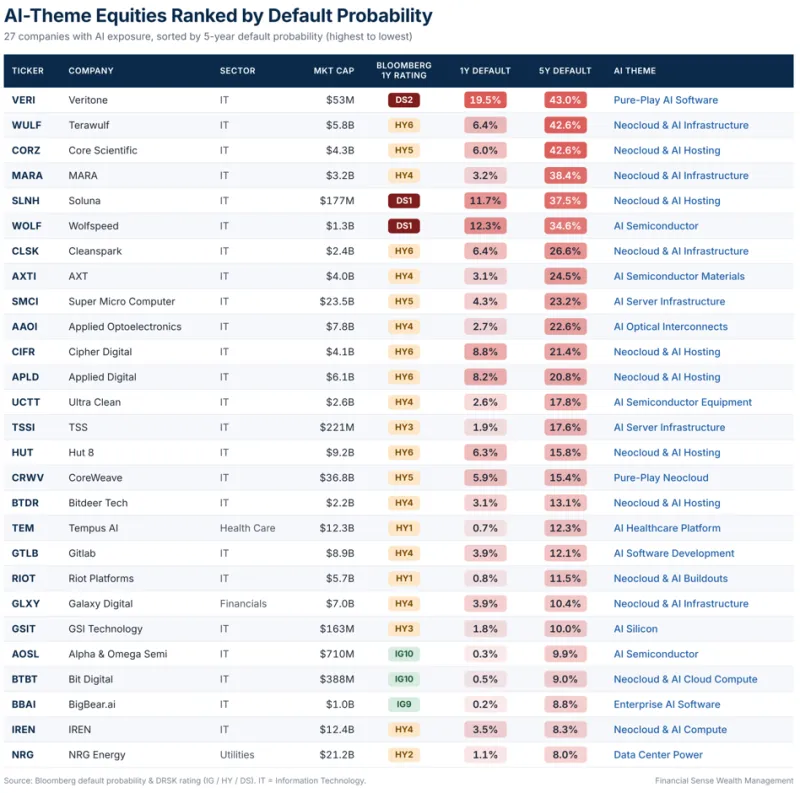
Warning signs extend beyond pricing to credit markets, which often lead equities at major turning points. We screened every company in the Russell 3000, an index representing roughly 98% of U.S. stock market capitalization, and focused on AI-related businesses. We then identified companies whose debt showed signs of distress and whose market pricing implied elevated default risk.
The results below highlight 27 AI-related companies with Bloomberg estimates of 5-year default probabilities of 8% or more. Their combined equity value is currently $184B. That value could erode significantly if the default risk priced into their debt continues to rise.
Portfolio Strategy
Market tops develop over time, and bubbles are often clearest in hindsight. The AI boom could continue into 2027 and beyond, making our concerns premature. Still, the warning signs warrant attention. The economy may absorb a bust relatively well, but the stock market’s concentration in AI-related value and earnings leaves it more exposed.
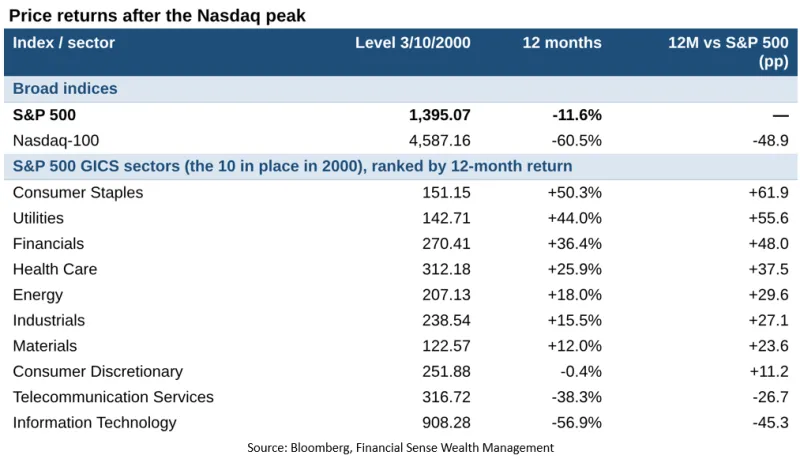
If investors begin selling AI stocks, the proceeds will need a new home. History suggests that, without an approaching recession, money can rotate into other sectors. After the March 2000 TMT peak, for example, a recession did not begin immediately. Investors moved from technology into smaller sectors of the S&P 500, driving outsized returns.
The table below shows the 12-month forward returns for major indices and S&P 500 sectors following the TMT peak. Seven sectors posted double-digit gains, while defensive sectors such as utilities and consumer staples rallied more than 40%.
Given valuations and our concerns about a peak in the AI boom, we are significantly underweight technology. We are monitoring our remaining technology holdings for meaningful technical weakness that could prompt further reductions. We are heavily weighted toward value stocks and also hold equities outside the U.S.
We currently assign a low probability to a U.S. recession on the horizon, so client portfolios remain invested at near-neutral risk levels. Several developments could lead us to increase or reduce exposure, including the midterm election results and a potential escalation in the U.S.–Iran war. President Trump has suggested that attacks on Iran could resume after the elections.
These events could drive market volatility. We will continue to monitor both market conditions and individual holdings, and we will share our assessment as the election results and the outlook for the conflict become clearer. If you have questions about your portfolio, please contact your wealth advisor.



Comments
Log in or sign up to join the conversation.