

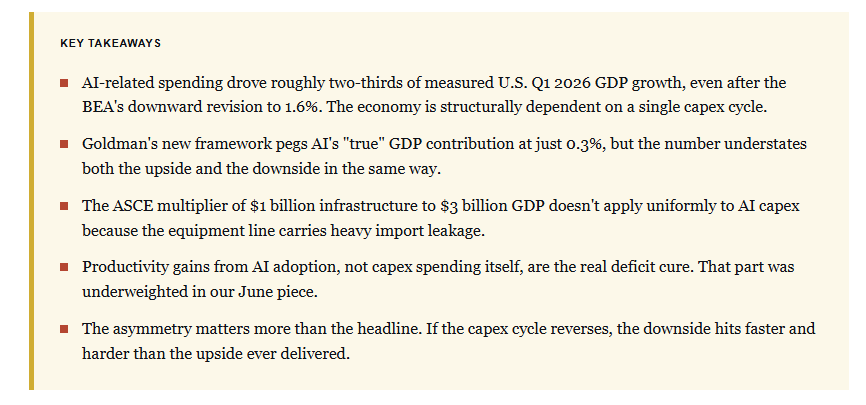
Just over a year ago, I made the case that the deficit narrative would find its cure in artificial intelligence. Goldman Sachs has since published research that, on first reading, appears to refute. It isn’t. But after more than thirty years of watching capex cycles play out, I’ve learned the right move when new data lands is to test the original argument against it. So far, that thesis from June 2025 holds. However, the AI capex risk profile has gotten sharper since then, and the argument needs tightening in a few places. The bull case and the tail risk are now the same buildout, but they are running in different directions.
The case I made last June rested on a straightforward chain. The deficit narrative was overstated. AI infrastructure would lift GDP. A higher denominator would stabilize debt-to-GDP. That chain still holds. However, Goldman’s economics team, led by Elsie Peng, just published a careful look at how much of all this AI capex actually flows through to measured U.S. GDP, and the answer landed well below most published estimates.
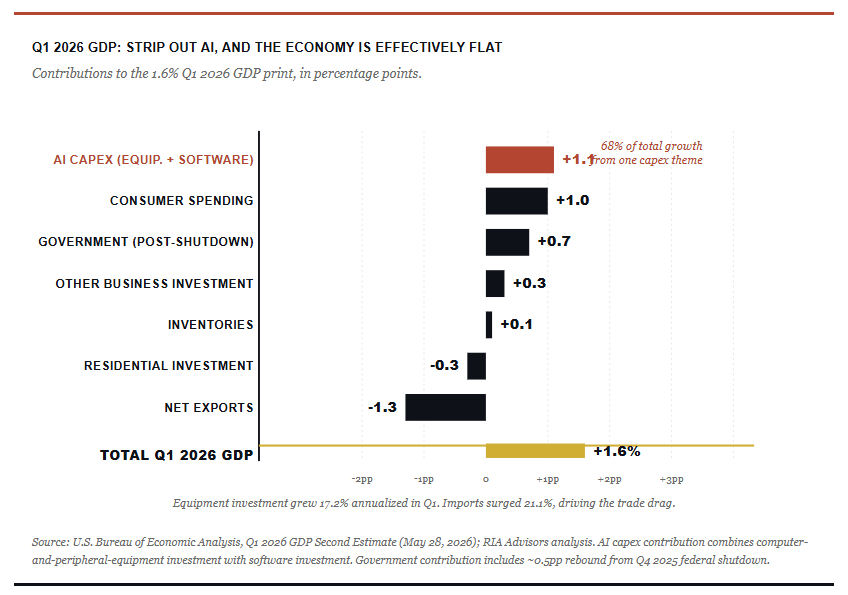
The backdrop has also gotten messier. The BEA’s second estimate revised Q1 2026 GDP growth down to 1.6% from the 2.0% advance estimate, with most of the downgrade attributable to inventory investment. Strip out the rebound in federal spending after the Q4 government shutdown, and core domestic demand looks softer than the headline. Middle East supply shocks, lingering tariff effects, and tighter immigration are all weighing on the consumer side. That backdrop turns AI capex risk from an academic question into a portfolio-management one. AI capex isn’t just a contributor to growth. It’s increasingly the entire growth story.
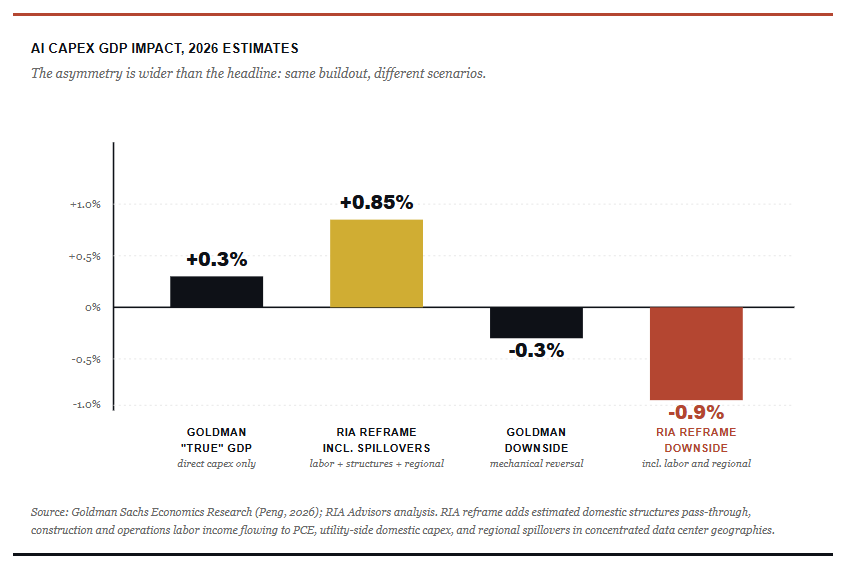
According to Goldman, AI-related spending will reach $800 billion annualized by year-end and contribute roughly 3.3 percentage points to “true” capital expenditure growth in 2026. So far, so consistent with the bull case. But here’s where it gets interesting. When that capex gets translated into actual GDP growth, the bank estimates a contribution of just 0.3% on a “true” basis and 0.1% on a measured basis.
That’s a small number. And it looks, at first glance, like a refutation of what I wrote in June. It isn’t. The Goldman framework is mechanically correct for what it measures, yet badly incomplete for what matters most to the deficit thesis. As we have noted previously, the difference between mechanical accounting and economic reality lies in where the actual investment opportunity lies.
Why The Original Multiplier Was Too Generous
There are three things in the June piece I’d write differently today.
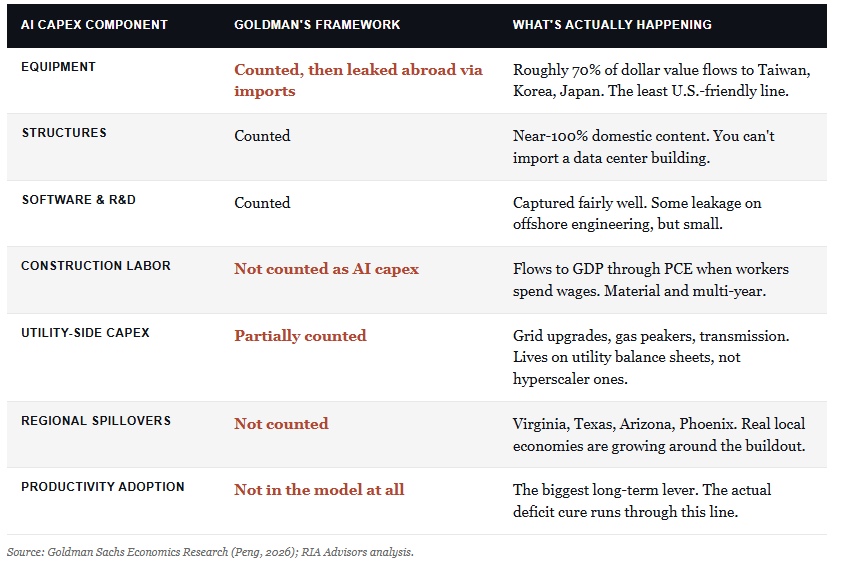
The first is the multiplier math. I used the American Society of Civil Engineers’ estimate that every $1 billion in infrastructure investment generates roughly $3 billion in GDP over a decade, and applied it to the $1.8 trillion in committed AI infrastructure to estimate a cumulative GDP impact of $5 trillion. The ASCE figure is real and well-supported. But it was estimated for traditional public infrastructure: roads, bridges, transit, and water systems. Those projects carry near-100% domestic content. AI capex doesn’t.
Goldman makes the point sharply. Much of the equipment in this buildout (servers, memory storage, advanced semiconductors, and some power transmission gear) gets sourced from Taiwan, Korea, and Japan. Those dollars leave U.S. shores at the point of equipment sale. They show up in those countries’ export numbers, not in U.S. GDP. The structures portion (data centers, power facilities, transmission upgrades) does carry near-100% domestic content, but the equipment portion does not. So a blended multiplier closer to 2:1 is more defensible than the 3:1 figure I used.
This haircuts the original GDP math, of course, but it doesn’t kill the thesis. Even at 2:1, $1.8 trillion of committed spending lifts cumulative GDP by roughly $3.6 trillion over a decade. The debt-to-GDP improvement is smaller than I projected, but the direction holds.
Productivity Is What Actually Cures Deficits
The second adjustment matters more. I underweighted productivity in the June piece. The line about “AI-driven productivity gains” appeared near the conclusion. It should have been the headline.
Make no mistake, capex is the visible, measurable, GDP-accounted-for portion of the AI story. That’s what Goldman counts. That’s what shows up in BEA tables. But the historical record on debt-to-GDP improvement is unambiguous. The periods where the ratio actually improved were periods of productivity acceleration, not periods of investment line growth.
Look at the post-World War II era. Then look at the 1990s tech boom. Both featured strong capex, of course, but the deficit improvement came from total factor productivity gains compounding through services, manufacturing efficiency, and labor output. The capex was the down payment. The productivity gains were the payoff.
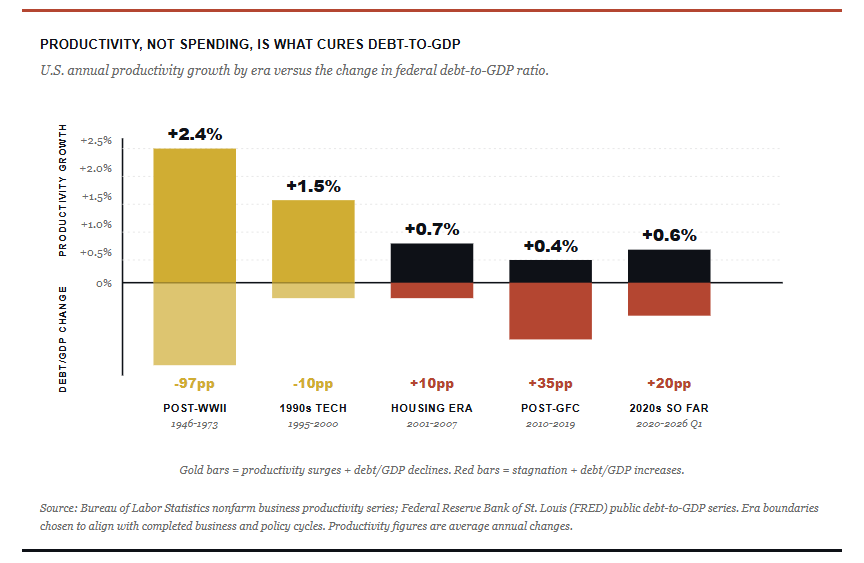
That’s why the bull case for AI’s impact on the deficit isn’t really about how many data centers get built. It’s about whether AI adoption accelerates productivity across the economy in healthcare, in software development, in logistics, in financial intermediation, in professional services. Those gains compound. They don’t suffer import leakage. And they’re exactly what CBO projections systematically fail to model. The productivity lens also reframes the AI capex risk question. If adoption matures on time, the buildout pays off. If it doesn’t, you’re left holding a one-trick economy.
The Asymmetry In AI Capex Risk Is Wider Than The Framework Shows
Now we come to the part of the original piece that I’d weigh much more heavily today. The asymmetry between upside and downside is sharper than I gave it credit for, and it stems directly from the same understatement in the Goldman framework.
Goldman’s 0.3% number captures direct investment lines but leaves out the domestic structures pass-through, the labor income flowing into PCE through construction workers and operators, the utility-side domestic capex, and the regional spillovers in concentrated data center geographies. A more inclusive accounting probably puts the AI footprint closer to 0.7% or 0.9% of GDP. Still not transformative, but materially larger than the headline implies.
Here’s the catch. Those same components that get undercounted on the way up will absolutely show up on the way down. Goldman models a dot-com-style reversal scenario and estimates a drag of 0.2 to 0.4 percentage points on GDP. However, if the AI capex cycle rolls over for real, the structures, the labor, and the regional spillovers don’t quietly vanish from the data. They contract violently. Construction trades lay off in waves. Utility capex gets stranded. Regional economies built around data center clusters take real damage all at once. The 0.2-to-0.4 figure is itself an understatement, for exactly the same reason Goldman’s upside number is.
So the AI capex risk is wider than the framework shows. The understatement that masks the upside also masks how violent the downside could be. That’s the part of the deficit-narrative argument that I want to put a sharper point on this time around. The bull case from June is intact. The tail risk has gotten louder.
What AI Capex Risk Means For Portfolios
The investment implications shift in a useful way. The original list of beneficiaries still holds: utilities, infrastructure plays, hyperscalers, and picks-and-shovels names like Caterpillar (CAT) and United Rentals (URI). But the framework for sizing those positions should change.
First, productivity adoption matters more than buildout exposure. Companies whose products embed AI into existing workflows and deliver measurable productivity gains to their customers will compound returns more durably than companies whose revenue depends on the next quarter of hyperscaler capex orders. The software and services layer is where the productivity story plays out over time. That’s where I’d be willing to pay up.
Second, the buildout names still work, but treat them as cyclical exposures rather than secular ones. The 2000-2001 dot-com bust offers a real template for how fast capex revenue can contract when expectations turn. Position sizes should reflect that. As we have noted previously in our work on AI productivity and innovation, the timing question is harder than the direction question.
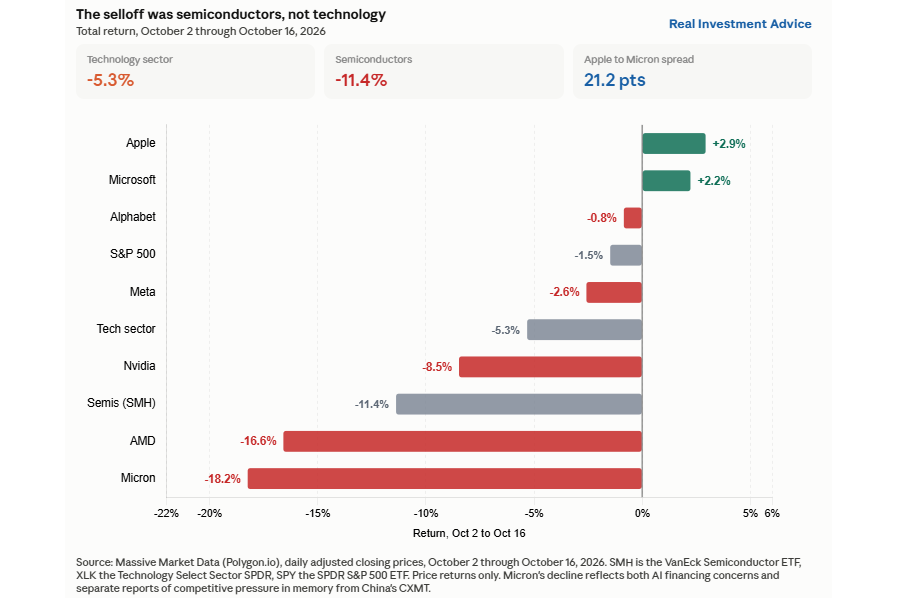
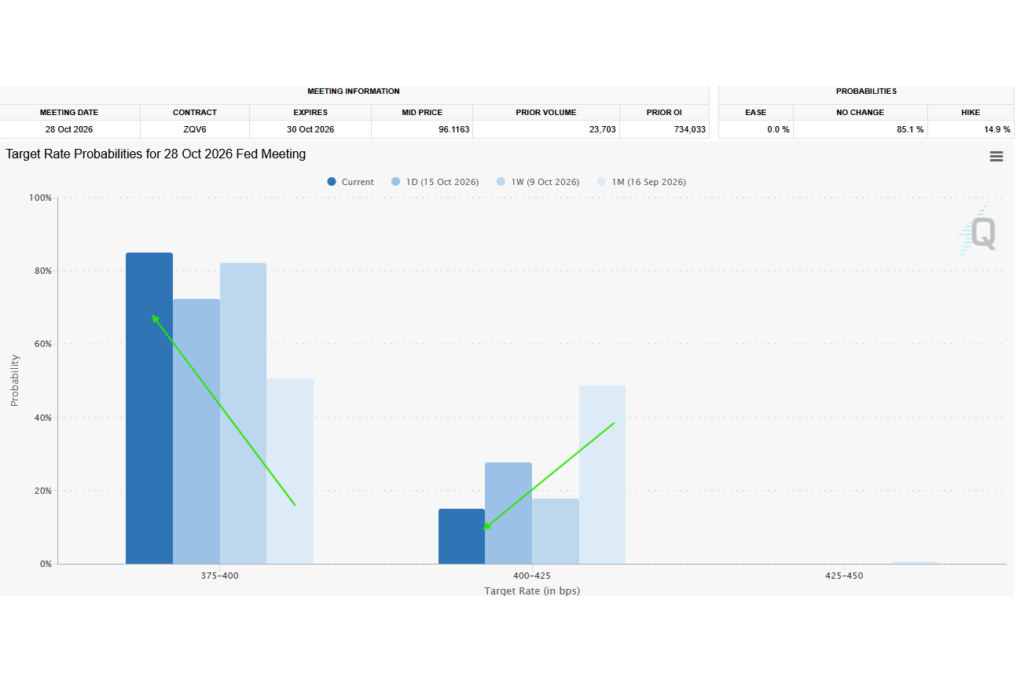
Third, watch the financing side closely. The current AI capex cycle is increasingly funded by debt and circular vendor-financing arrangements among hyperscalers, chipmakers, and data center developers. That’s a different risk profile than capex funded by retained earnings. Goldman’s research desk also flagged a labor bottleneck in May, with roughly 600,000 skilled trade openings against an apprentice pipeline of about 150,000 per year. So even if the capital is there, delivery timelines may slip. If financing conditions tighten or labor capacity caps the pace of the buildout, the capex reversal scenario gets pulled forward.
The bottom line is the thesis from June still holds, but the prescription is different. Bet on productivity adoption, not on capex multipliers alone. Stay diversified across the buildout’s beneficiaries. And size positions for an asymmetric risk profile, because the same buildout that’s driving 75% of GDP growth right now will cut the other way fast if it stops.
The Cure Is Still There, But It Lives In A Different Place
The June 2025 piece argued the deficit narrative had a cure in artificial intelligence. Just over a year on, I’d say the cure is still there, but it lives in productivity, not in spending lines. The prescription requires watching the AI capex cycle the way an emergency room watches a patient. You’re looking for the signals that decide whether this becomes the recovery story or the next recession.
Importantly, neither outcome is foreordained. The capex cycle could roll on for another two or three years before adoption catches up to the buildout, in which case the productivity gains arrive on time and the debt-to-GDP trajectory bends in the right direction. Or capex expectations could break before adoption matures, in which case we get a violent unwind that takes a chunk of GDP with it. The setup right now contains both paths. Position accordingly.
Sources & References
U.S. Bureau of Economic Analysis, “GDP Second Estimate, 1st Quarter 2026,” released May 28, 2026. bea.gov. Third estimate scheduled for release June 25, 2026.
Goldman Sachs Economics Research, “AI Capex and the GDP Math,” analysis by Elsie Peng and team, May 2026.
Goldman Sachs Research, “AI buildout labor bottleneck,” May 13, 2026, on skilled trade capacity constraints through 2027-2028.
Bureau of Labor Statistics, “Productivity and Costs, First Quarter 2026, Revised,” USDL 26-0785, June 4, 2026. bls.gov.
American Society of Civil Engineers, “Failure to Act: Economic Impacts of Infrastructure Investment Gaps,” ASCE Infrastructure Economic Report Series.
McKinsey & Company, “The economic potential of generative AI,” industry capex projection through 2030.
Congressional Budget Office, “The Budget and Economic Outlook,” historical projection accuracy and methodology notes.
Federal Reserve Bank of St. Louis (FRED), historical federal debt-to-GDP series.
Roberts, L. “The Deficit Narrative May Find Its Cure In Artificial Intelligence,” RIA Advisors, June 2025.
Roberts, L. “AI Productivity And Innovation: Prosperity Or Engels Pause?” RIA Advisors, May 2026.
Roberts, L. “AI Productivity, Employment and UBI” RIA Advisors, January 2026

Comments
Log in or sign up to join the conversation.