

<< Read More: Beyond The Pair: Ranking A Full Sector With Paired Comparisons, And How Much You Can Trust It - Part II
Every stock valuation eventually answers one of two different questions, and most of the arguments about "which method is right" happen because people don't realize they're arguing about different questions.
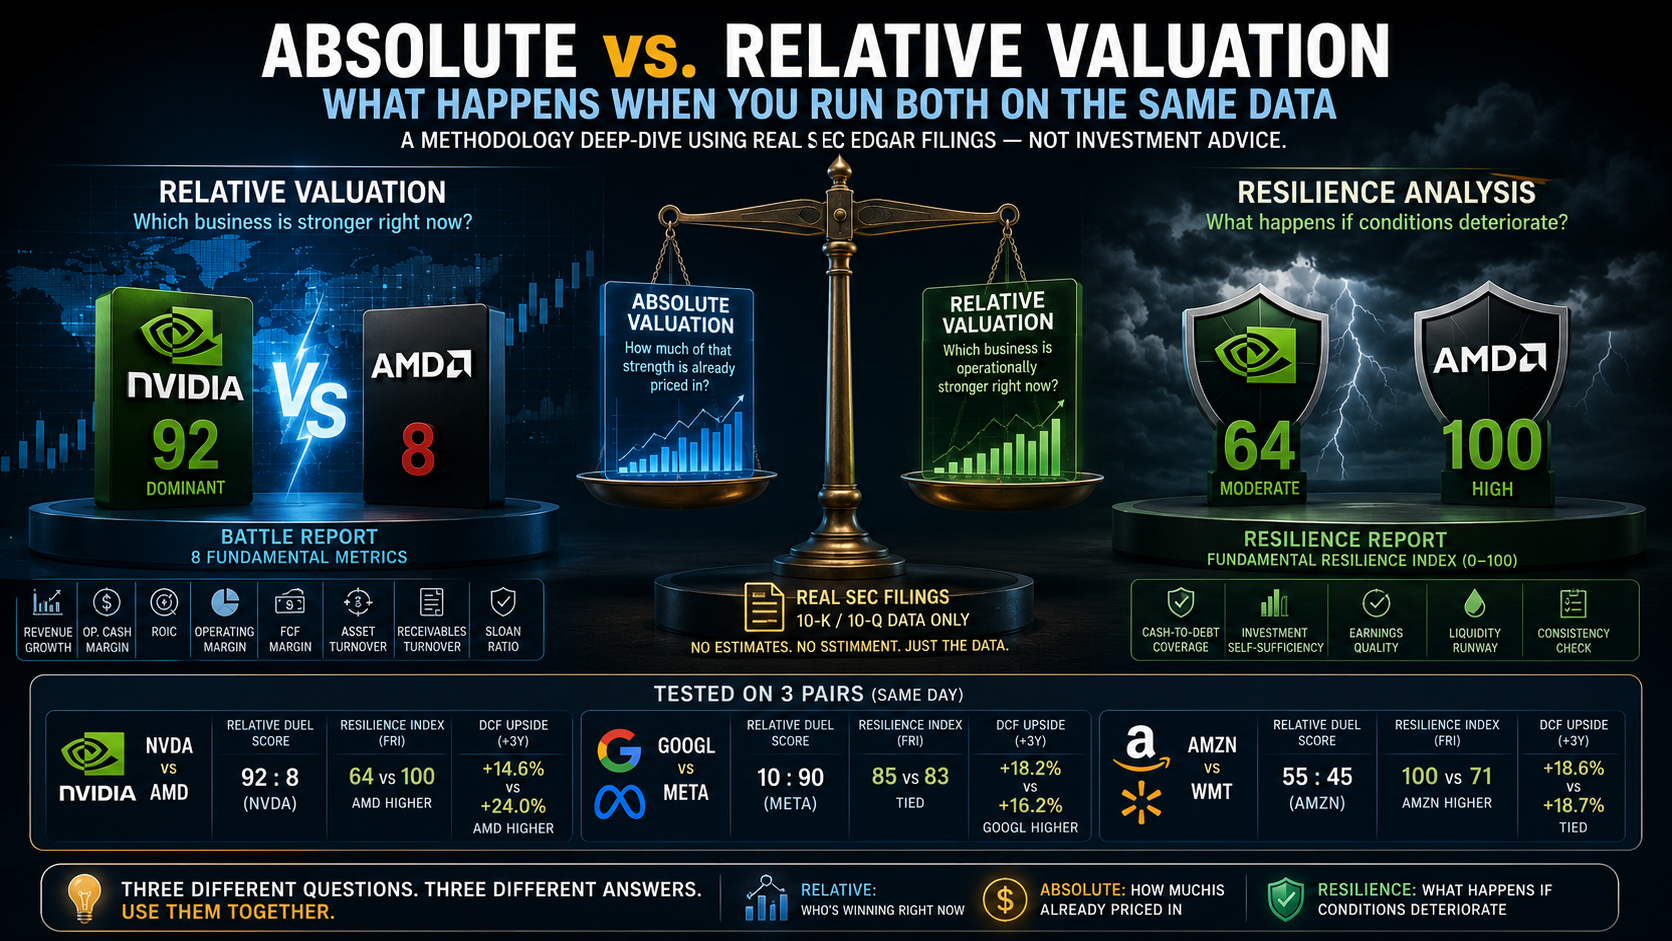
This piece walks through the theory, then tests it on real numbers — NVIDIA (NVDA) vs. AMD (AMD), Google (GOOGL) vs. Meta (META), Amazon (AMZN) vs. Walmart (WMT) — using a tool I built that pulls fundamentals straight from SEC 10-K/10-Q filings. No analyst estimates, no sentiment, no price action — just the filings.
Part 1 — Two Ways to Ask "What Is This Company Worth"
Intrinsic (absolute) valuation builds a company's value from the inside out — project future cash flows, discount them back at a rate reflecting risk, done. This traces back to John Burr Williams' The Theory of Investment Value (1938): an asset is worth the present value of what it will pay you. DCF, dividend discount models, and residual income models all live here.
Relative valuation never values the company on its own — it values it against peers, on the assumption the market has priced comparable businesses roughly correctly, and the gap between your target and the group is the signal. Multiples (P/E, EV/EBITDA) and peer-ranking systems belong here.
Neither is "more correct." They rest on different assumptions about what you can know. Absolute valuation assumes you can out-forecast the market. Relative valuation assumes the market is roughly right on average and your job is to spot the outlier.
Where DCF earns its keep, and where it breaks: it's the only method deriving value from the actual cash-generating engine of the business, independent of what anyone's paying for a comparable company. That's powerful when whole sectors go mad (2000, 2021). The catch — well documented by Aswath Damodaran — is that DCF outcomes are absurdly sensitive to three inputs: growth rate, discount rate, and terminal value. Terminal value alone routinely makes up 60–80% of total enterprise value, built on a single point estimate of perpetual growth. You get a number precise to the cent, built on an assumption nobody can verify.
Where multiples earn their keep, and where they break: they're fast, they scale across hundreds of names, and they encode information a spreadsheet can't easily capture — management quality, regulatory risk, sector sentiment. The structural weakness is circularity: relative valuation only works if the peer group is priced correctly on average. If an entire sector is inflated, relative valuation will happily confirm your target is "cheap relative to peers" while the whole group is expensive relative to reality.
Table 1 — Head-to-head comparison
Criterion | Absolute Valuation (DCF / DDM / RIM) | Relative Valuation (Multiples / Peer Scoring) |
|---|---|---|
Theoretical basis | Present value of future cash flows (Williams, 1938) | Law of one price, weak-form market efficiency |
Data source | Forecasts of the company's own future performance | Current/historical data of comparable companies |
Dependence on the market | Independent of current price | Fully dependent — value is a function of peer prices |
Number of critical assumptions | High (growth, WACC, terminal growth) | Low (peer group choice, weights) |
Sensitivity to error | Very high — terminal value dominates EV | Moderate — spread across the peer group |
Systematic bias risk | Analyst optimism in growth forecasts | Circularity — a mispriced sector confirms itself |
Company-specific risk | Explicit (via WACC, cash flow quality) | Usually implicit or absent |
Speed / scalability | Low — labor-intensive per company | High — trivially applied across dozens of names |
Transparency to the user | Low unless assumptions are disclosed | High — "cheaper than peers" is intuitive |
Resilience to sector bubbles | Theoretically resilient | Vulnerable — inherits the sector's mispricing |
Typical user | Appraisers, long-term value investors | Sell-side analysts, retail screening |
Part 2 — Testing Both Methods on the Same Companies, at the Same Time
Rather than pick one method, I built a tool to run both side by side on the same SEC filing data, plus a third layer measuring balance-sheet resilience. Three separate reports, three separate questions:
Battle Report (relative) — 8 fundamental metrics (Revenue Growth, Op. Cash Margin, ROIC, Sloan Ratio, Asset Turnover, Receivables Turnover, Operating Margin, FCF Margin), weighted into a 0–100 score per side.
DCF Report (absolute) — a full 3-year DCF with quality-adjusted growth: a Sloan Ratio penalty for aggressive accrual accounting, an ROIC multiplier that scales projected growth by capital efficiency, and an FCF-margin multiplier for cash-conversion quality. WACC is derived from an ROIC tier rather than historical price volatility.
Resilience Report — a Fundamental Resilience Index (0–100) built from cash-to-debt coverage, investment self-sufficiency (FCF/CapEx), earnings quality (CFO/Operating Income), and liquidity runway, with a consistency-check matrix flagging internal contradictions.
Being upfront about the limits of this approach: there's no sensitivity table or Monte Carlo range on the DCF output (a known trade-off vs. a full point-estimate model), no explicit country risk premium (fine for US large caps, a gap for international names), and the relative layer compares one pair at a time rather than a full peer-group median. None of that makes the numbers useless — it just means read them as directional evidence, not gospel.
Part 3 — The Case Study: NVIDIA vs. AMD
The relative score: 92–8, "Dominant," in NVIDIA's favor.
Metric | NVDA | AMD | Weight |
|---|---|---|---|
Revenue Growth (3Y CAGR) | 100.05% | 13.64% | 16% |
Op. Cash Margin | 47.57% | 22.26% | 15% |
ROIC | 51.01% | 4.46% | 15% |
Operating Margin | 60.38% | 10.66% | 12% |
FCF Margin | 47.50% | 19.44% | 12% |
Asset Turnover | 0.83x | 0.43x | 10% |
Receivables Turnover | 5.30x | 5.74x | 8% |
An ROIC gap of 51% vs. 4.5% is not rounding error. On pure operating fundamentals, this isn't close.
The absolute number tells a different story:
Parameter | NVDA | AMD |
|---|---|---|
Enterprise Value (T0) | $4,285.24 B | $108.03 B |
Fair Value per share (T0) | $176.47 | $67.72 |
WACC (from ROIC tier) | 8.95% | 11.56% |
Fair Value, +3 years | $202.24 (+14.6%) | $83.98 (+24.0%) |
Despite losing the duel 8-to-92, AMD's modeled 3-year upside is higher. NVIDIA's dominance is already priced into a ~$4.3T enterprise value; even at the model's capped 35% growth rate, the percentage upside from an already-massive base is smaller than AMD's more modest growth compounding off a much lower one. Relative valuation tells you who's winning right now. DCF tells you how much you've already paid for that win.
The resilience layer adds a third, unexpected wrinkle:
Metric | NVDA | AMD |
|---|---|---|
Resilience Index (FRI) | 64 — Moderate | 100 — High |
Cash-to-Debt Coverage | 12.24x | 4.12x |
Investment Self-Sufficiency (FCF/CapEx) | 739.39x | 6.91x |
Earnings Quality (CFO/Op. Income) | 0.79x — flagged | 2.09x |
Liquidity Runway | 0.5 years — flagged | Infinite |
A company that just won the duel 92–8 and carries a $4.28T DCF-derived enterprise value scores lower on resilience than the company it demolished. Worth a caveat: with $102.7B in operating cash flow, nobody seriously thinks NVIDIA has a liquidity problem — the runway metric here is almost certainly a formula artifact on a balance sheet shape the metric wasn't built for. But the earnings-quality flag (operating income exceeding operating cash flow) is a real, if minor, signal worth knowing.
Cross-checked on two more pairs, same day:
Pair | Relative Duel Score | Resilience Index (FRI) | DCF Upside (+3Y) |
|---|---|---|---|
NVDA vs AMD | 92 : 8 (NVDA) | 64 vs 100 — AMD higher | NVDA +14.6% vs AMD +24.0% |
GOOGL vs META | 10 : 90 (META) | 85 vs 83 — essentially tied | GOOGL +18.2% vs META +16.2% |
AMZN vs WMT | 55 : 45 (AMZN) | 100 vs 71 — AMZN higher | AMZN +18.6% vs WMT +18.7% — tied |
Same pattern, three separate times: a lopsided relative score does not reliably predict either the resilience ranking or the absolute-return ranking.
Conclusion
Relative valuation answers "which business is operationally stronger right now" — and does that job well. Absolute valuation answers "how much of that strength is already priced in." A resilience overlay answers "what happens if conditions deteriorate." These are three different questions, and treating any one of them as a complete answer is where most valuation arguments — professional and retail alike — go wrong.



Comments
Log in or sign up to join the conversation.