
- SPX Monitoring purposes; Flat.
- Purposes Gold: Long GDX on 1/29/19 at 21.96.
- Long-Term Trend SPX monitor purposes; Sold SPX 7/5/19 & 2990.41= gain 2.63%.
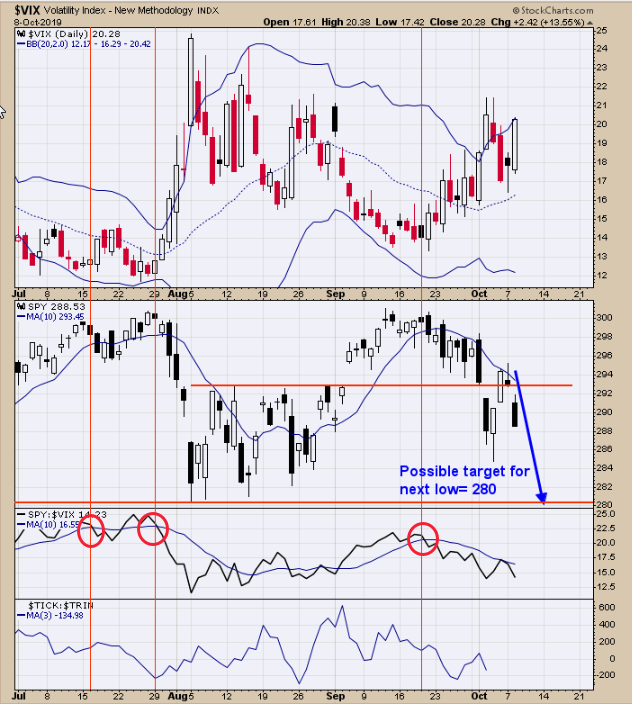
The second window up from the bottom is the SPY/VIX ratio with a 10 period moving average. In the up-trends SPY outperforms the VIX and that happens when this ratio is rising and in the downtrends, the VIX outperforms which in turn makes this ratio to decline. This ratio started its decline in mid-September and remains below its moving average (red circle). Further insight would have come from the 3 MA of the TICK/TRIN ratio (bottom window) but Stockcharts vendor no longer supports that symbol so this ratio is no longer accurate. Hopefully, a new source for the tick will be found. Tick did close today at -176 and usually not high enough to signal a possible low. A target to the 280 SPY level is possible this week or next and then it should go higher.
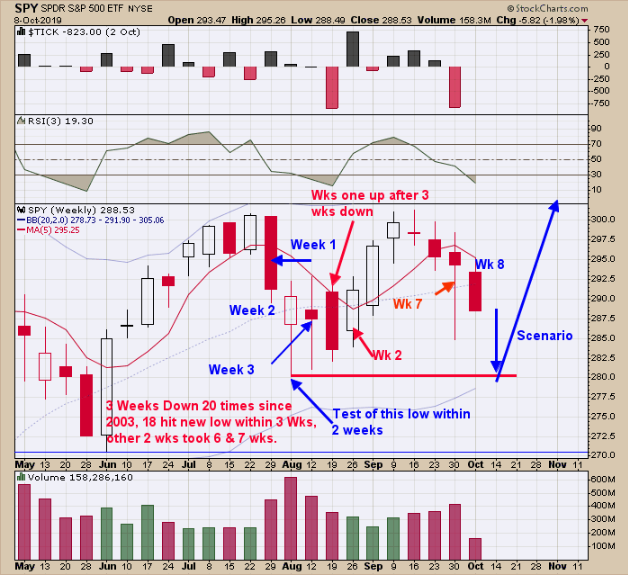
We updated this chart from yesterday's market trading. Above is the weekly SPY chart. We previously mentioned on our reports about a quant method that said, “Three weeks down in a row on the SPX have happened 20 times since 2003, 18 hit new lows within 3 weeks and the other two hit new lows on week 6 and 7.” Last week was week 7 which failed to hit below the August 5 low of 280 SPY (2800 SPX). This week is week 8 and also the week before option expiration, a week where whipsaws are common. If the market is going to test the 280 SPY level it would start to make since and I hope that will happen this week.
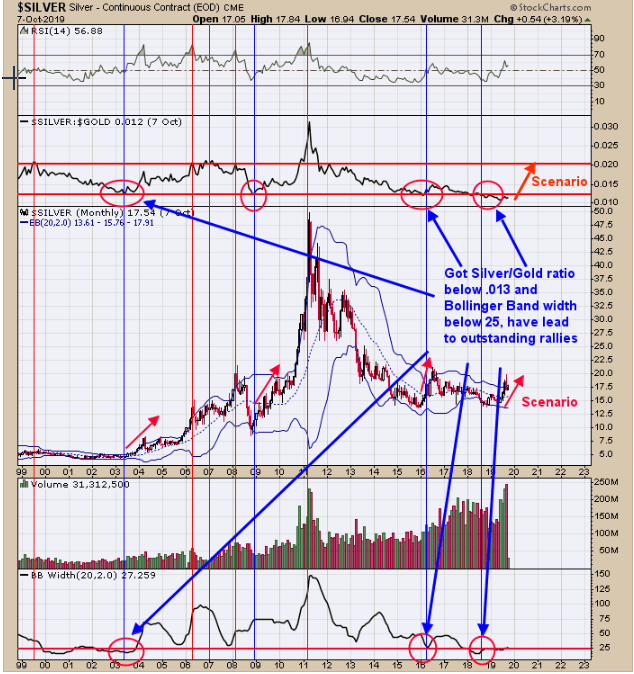
Above is the monthly Silver chart going back to 1999. The bottom window is the monthly Bollinger band Width for Silver. Longer-term lows have been found in Silver when the monthly Bollinger Bandwidth traded below .013 (which it did in mid-2018 (the bottom is silver) and again in June and July 2019). The second window down from the top is the monthly Silver/Gold ratio. In bull markets, silver outperforms Gold and that happens when the Silver/Gold ratio is rising. When this ratio is very low (below .013) it shows that Silver is cheap compared to Gold and usually that means there is a good area to buy silver. The ratio stands at .012 right now. The top window is the monthly RSI for Silver. RSI readings above 50 suggest that Silver is in an uptrend (current reading is 56.88). Though silver has rallied the last couple of months both the Silver/Gold ratio and Bollinger bandwidth suggest that this rally has the potential to go further. Long GDX on 1/29/19 at 21.97.
Comments
Log in or sign up to join the conversation.