


One can think of the current stock market in real estate terms – it’s a building with wonderful curb appeal, but its pleasant facade hides some structural issues that might be compromising the edifice’s overall integrity. At the start of September, historically a tricky month for stocks, we noted that “seasonality is a fickle guide.” A roughly unchanged S&P 500 (SPX) and a 3% gain in the Nasdaq 100 (NDX) that included a new all-time high belief in the “September scaries.” Yet 2-year yields have risen nearly 60 basis points during the month, and other equity measures show cracks in the foundation.
As you might have noticed, I haven’t written in a while. I had to deal with some personal matters, so my perspective on markets was different from usual. Rather than paying close attention to intraday moves and news, I paid only cursory attention to markets as other matters consumed my attention. For a market commentator, this can be a good thing because it forces us to synthesize information in a relatively unfamiliar manner. Thus, I noticed that even as yields climbed steadily higher, the broad indices mentioned above seemed relatively placid, nonetheless.
The last piece I published concluded with the following paragraph. That observation seems to have aptly described the events of the past few weeks:
Considering the gloomy picture being set by bonds, stocks really aren’t performing all that badly – at least at the major index level… Might this be another example of the “ratchet effect” in action, where good news is handsomely rewarded and bad news is greeted with a relative shrug? Quite possibly. The dearth of economic news and earnings reports has stocks focused on geopolitical and internal market narratives, and since stock investors tend to pick and choose which geopolitical issues matter on any given day, it is hard to imagine that equities will truly capitulate before the latest enthusiasm for AI fades.
After a few days without checking, however, I noticed that many of my favorite stocks were not keeping pace with the broader market. I thought it could simply be selective bias, but even a cursory look at other market measures showed that the large indices were indeed the outliers masking some key divergences.
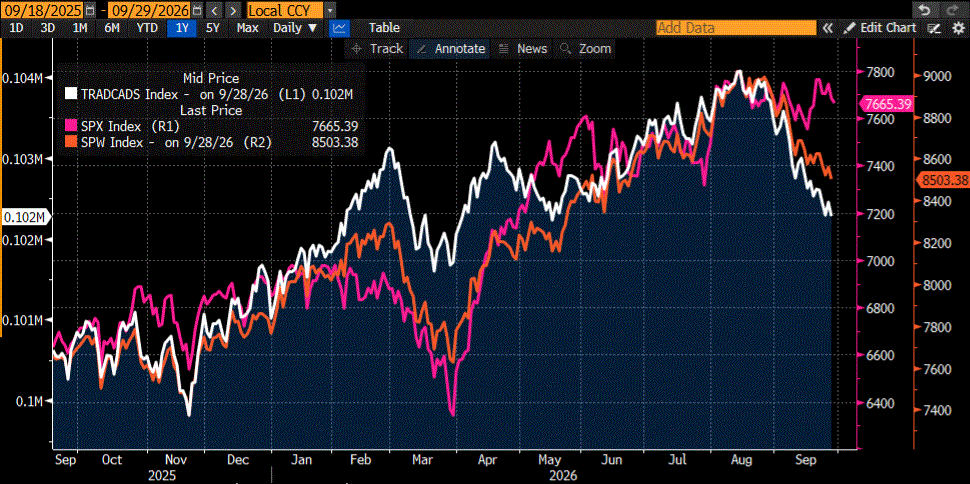
The following chart shows that even though SPX moved sideways throughout the month with some modest volatility, there has been considerable erosion under the surface. For most of the past year, SPW, the equal-weighted version of SPX, had not only kept up with the cap-weighted benchmark but had surpassed its performance at various points. The index’s advance-decline line kept pace with both measures and outperformed them when SPW was the leader. That should not be surprising, given that a rise in SPW requires solid performance from the majority of the index’s components. Conversely, the top-heavy nature of SPX means that it can rise on the strength of its largest components. The outperformance of megacap tech stocks is obscuring the poor performance of many key index constituents.
1-Year, SPX Advance-Decline Line (white, left scale), SPX (magenta, near right scale), SPW (orange, far right scale)
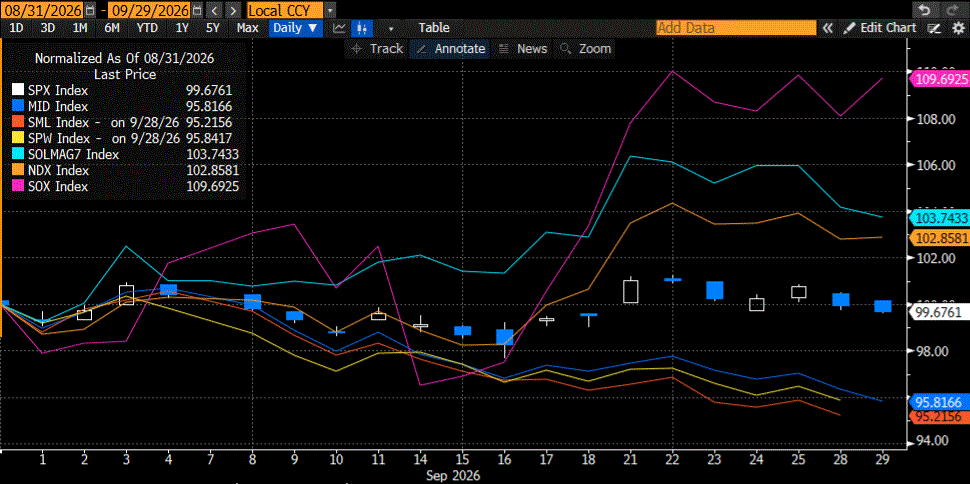
This type of underperformance is not limited to SPX. When we zoom out to look at the relative performances of indexes that represent a range of market capitalizations, we see something quite similar. The chart below shows the normalized month-to-date performances of SPX alongside NDX, SPW, SML (S&P Small Cap 600 Index), MID (S&P Midcap 400 Index), SOX (Philadelphia Semiconductor Index), and the Solactive Magnificent Seven Index (SOLMAG7). The AI trade, as evidenced by SOX and the Mag 7, is clearly driving NDX and, to a lesser extent, SPX; meanwhile the broader indices (SPW, MID, SML) are all down about 4-5% so far this month.
Month-to-Date, SPX (blue/white candles), MID (dark blue line), SML (red), SPW (yellow), SOLMAG7 (light blue), NDX (orange)
We can portray this in other ways, such as the preponderance of new lows versus new highs, the failure of broader advance-decline lines to confirm the index advances, and more. And of course, this is not to mention the dire messages being sent by Treasury markets this month, which include:
2-year yields up by 58 basis points (4.34% to 4.92%)
10-year yields up by 52 basis points (4.75% to 5.27%), above their pre-Global Financial Crisis highs
30-year yields up by “only” 26 basis points, but to their highest level since 2002
Bottom line: the cost of money, as denoted by higher yields, has gotten significantly more expensive in a very short period of time. The majority of stocks have taken notice of that inconvenient fact. But with equity investors more than willing to invest in, if not crowd into, AI-linked favorites, the most popular stock market measures don’t reflect the erosion in vast areas of the market ecosystem. The facade remains attractive, even if the building’s foundation shows some cracks.



Comments
Log in or sign up to join the conversation.