


Among the most common questions that I receive involve something along the lines of “why is VIX so low?”, or “why does VIX seem so complacent?” My reflexive response to the former tends to be along the lines of “compared to what?”, while my snarky retort to the latter is “VIX is not a fear gauge, though it plays one on TV.” There are indeed more complete answers, but they require more than a sentence or two to unpack.
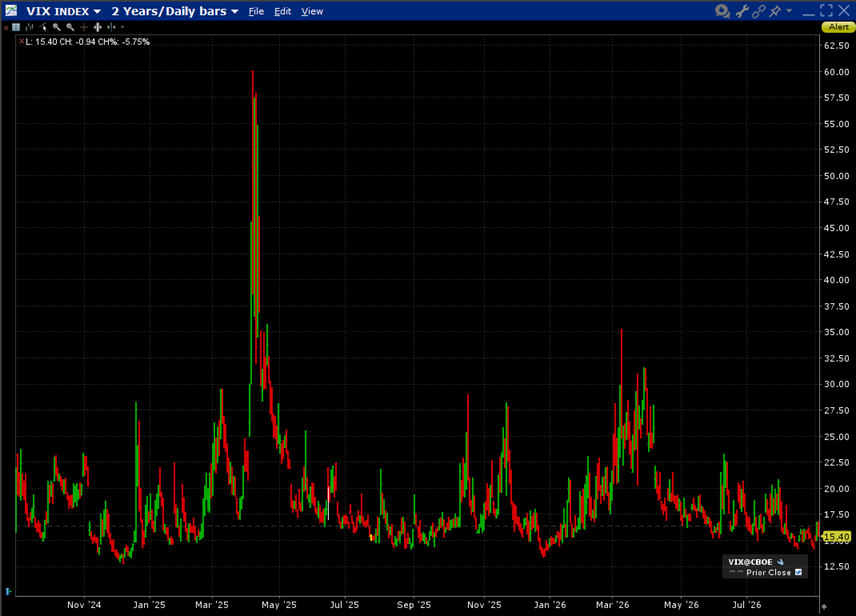
Regarding the low level of VIX (Cboe Volatility Index): Although it has been meandering around 15, that has been the low end of its trading range for the better part of two years. That should be apparent in the chart below, especially when we compare it to the index’s 100- and 200-day moving averages. Indeed, the only times we have seen VIX dipping appreciably below last week’s 14.1 level were around Christmastime each of the past two years. Nonetheless, the index has spent plenty of time in the mid-teens. It seems fair to say that VIX is indeed low, but not unusually so.
VIX, 2-Years Daily Bars
One reason for the persistently low level of VIX has to do with the persistently low levels of correlation and high levels of dispersion within the S&P 500 (SPX). Remember, VIX uses SPX options with an average time to expiration of 30 days as the basis for its calculation (and nothing explicitly involving sentiment). When the index’s components move in opposite directions, that dampens the index’s volatility. When they move in synch, those moves tend to seem amplified. Since correlation and dispersion can be generally thought of as inverse measures (not mathematically, per se, but in a general sense), high levels of correlation tend to correspond with low levels of dispersion, and vice versa.
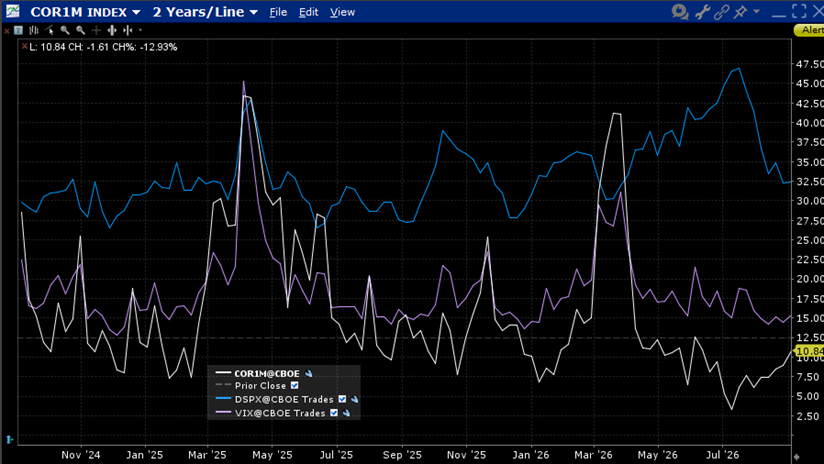
When correlation measures, like the Cboe 1-Month Implied Correlation Index (COR1M), are low, and/or dispersion measures, like the Cboe S&P 500 Dispersion Index (DSPX), are high, that tends to suppress SPX volatility, and thus the perceptions of future SPX volatility measured by VIX. We recently saw COR1M at a multi-year low and DSPX at a multi-year high. Thus, it was hardly surprising to see VIX bouncing along near the low end of its longer-term trading range, as noted above.
Yet something interesting is occurring. Although COR1M has risen notably and DSPX has fallen quite sharply in recent sessions, VIX has remained at relatively low levels. Given their relationship with index volatility, one should expect to see VIX firming up. Certainly, it bounced off its lows during the declines of the past couple of days, but it seems to be lagging the other measures.
This strikes me as a potential opportunity. Options traders still seem to be in summer mode, thus expecting low volatility to persist. Part of this is the nature of the business – options traders hate spending money on decaying options until they absolutely must. Thus, many of them are undoubtedly waiting until tomorrow, just before the jobs report, or, more likely, until after Labor Day to buy options that might reflect the new correlation/dispersion metrics. Considering that VIX remains closer to a longer-term low than even its 100-day moving average and that much of the recent dispersion has been quelled, it seems like a better time to be buying VIX or SPX options than selling them.
2-Years, VIX (purple line), COR1M (white line), DSPX (blue line)



Comments
Log in or sign up to join the conversation.