


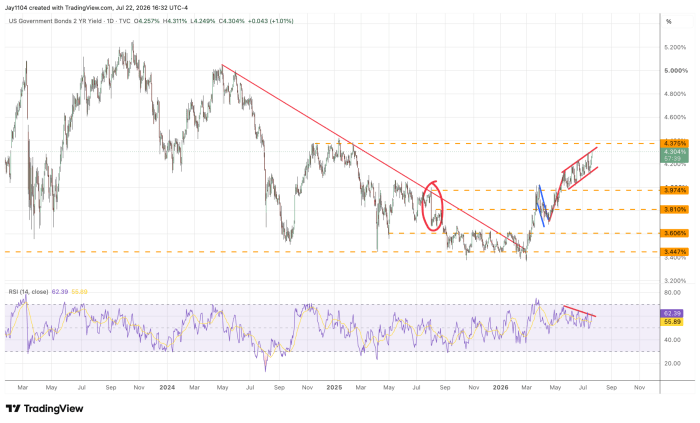
Rates moved higher again, with the 2-year Treasury yield rising to 4.3%. It is now approaching a level at which a significant move could be developing, either higher or lower. For now, the 2-year remains in a rising channel, which can serve as either a continuation pattern or, on occasion, a reversal pattern. More recently, however, I have found that these patterns have tended to act as continuation formations.
The 2-year still has more to prove and needs to break above resistance around 4.4%. If it can do that, the yield could be on its way significantly higher, potentially toward the 4.75% to 5.0% range.
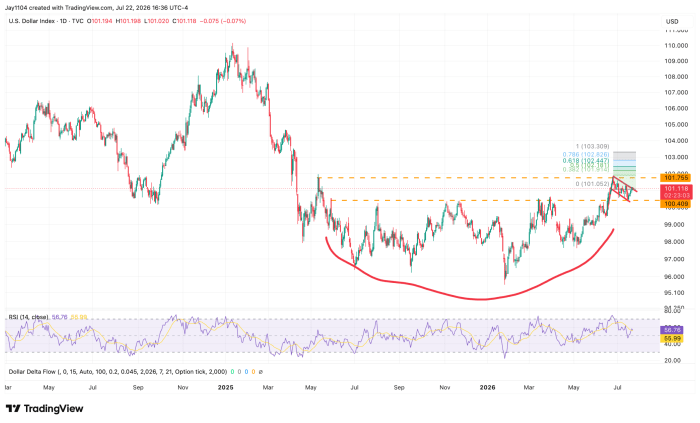
The dollar continues to form a bull flag pattern, and with the ECB meeting on Thursday, there is an opportunity for the next leg higher to develop. That is especially true if the ECB strikes a more dovish tone than markets expect. Currently, the market is pricing in just one additional ECB rate hike between now and the end of 2026.
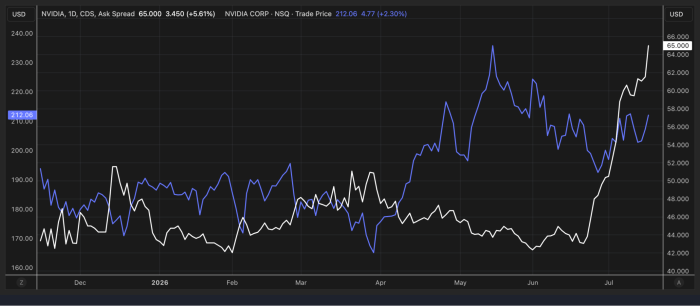
In the meantime, CDS spreads widened again today across the semiconductor sector, with Nvidia (NVDA) once again leading the move. The ask spread rose to 65 basis points, implying a roughly 5% cumulative default probability over five years. That remains a relatively low level in absolute terms. However, what stands out is the steady increase in the spread, which suggests the credit market is becoming increasingly cautious.
At the same time, Nvidia’s stock continued to rise today, meaning we remain in an unusual situation where the equity price is advancing even as the company’s CDS spread widens.
(LSEG)
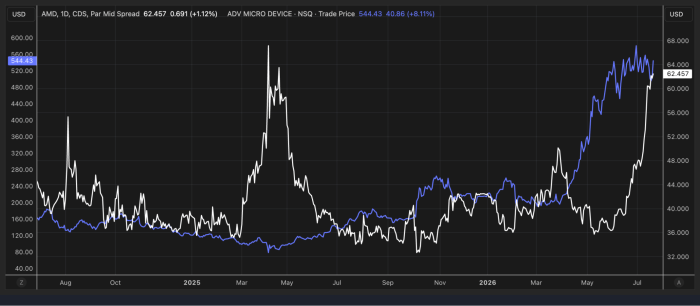
AMD's (AMD) CDS spread has widened modestly in recent weeks, even as the stock has continued to hold up well. Notably, the spread is now approaching levels seen during the tariff-driven sell-off, suggesting the credit market is becoming increasingly cautious despite resilience in the share price.
(LSEG)
What does the credit market know that the equity market doesn’t? It’s a fair question. Clearly, credit investors are seeing something that is leading to the persistent widening in CDS spreads, even as equity prices continue to climb. Whether that caution ultimately proves justified remains to be seen, but the growing divergence between the two markets is becoming increasingly difficult to ignore.


Comments
Log in or sign up to join the conversation.