

- The FAANG stocks, made up of Facebook, Amazon, Apple, Netflix, and Google (now Alphabet), serve as a representation of some of the biggest innovators and leaders in the technology sector.
- Tech index investing has changed. The Nasdaq-100 (related ETF QQQ) has matured and isn't just tech. Stocks like Pepsi, Costco & Starbucks are top 25 holdings.
- The Tech Select Index (related ETF: XLK) doesn't contain FANG stocks but does include IT services. Top 5 holdings include Apple but with Visa and Mastercard.
- FNGS (MicroSectors FANG+ ETNs) recently launched on the New York Stock Exchange.
The FANG stocks made up of Facebook, Amazon, Netflix, and Google (now Alphabet), serve as a representation of some of the biggest innovators and leaders in the technology sector. Sometimes, a second ‘A’ is added to make it “FAANG” for fellow technology titan, Apple. The NYSE® FANG+™ Index includes the five FAANG companies and five additional innovative leaders; Alibaba, Baidu, Nvidia, Tesla, and Twitter.
When people think of next-generation innovation or big tech investing, these companies typically come to mind. With over $4.3 trillion¹ in market capitalization and over $809 billion² in annualized revenues, the companies that make up the NYSE FANG+ Index are some of the most influential leaders in furthering technological transformation across numerous business segments in rapidly growing industries, such as cloud computing, e-commerce, virtual reality, online search, mobile phones, online advertising, online streaming, social media, semiconductors, videogames, autonomous driving, and artificial intelligence.
Historically, there hasn’t been a convenient way to invest in these stocks in a single trade. FNGS is meant to change that. How does FNGS compare to historical benchmarks in tech stocks like the Nasdaq-100 Index (related ETF: QQQ) or the Technology Select Sector Index (related ETF: XLK)? These are the two largest technology-related ETFs in the U.S., and we argue that they neither fully represent the technology landscape nor offer a pure solution to technology investing.
Technology Sector Index Landscape: Know Before You Trade
Did you know that companies like Pepsi, Comcast, Starbucks, Costco, and Charter Communications are all top 25 components of the Nasdaq-100 Index (related ETF: QQQ)? When you think about technology innovation, things like coffee, potato chips, and cable boxes don’t necessarily come to mind. While in the early 2000s the Nasdaq was the primary exchange for technology companies, since then the Nasdaq has catered to stocks of all sectors. As a result, the Nasdaq-100 Index, as outlined in the chart below, includes sectors such as Consumer Staples, Financials, Health Care, and Industrials.
(Click on image to enlarge)
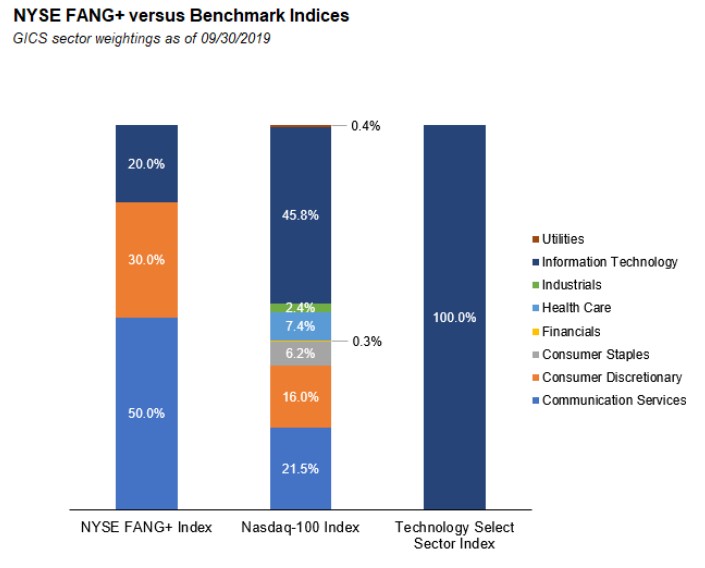
Source: Bloomberg, index data as of 09/30/2019.
Based on the above Global Industry Classification Standard (GICS) weightings, at first glance, the Technology Select Sector Index (related ETF: XLK) may seem like a great alternative to the Nasdaq-100. However, that may not necessarily be the case. The FANG stocks, Facebook, Amazon, Netflix, and Google (now Alphabet), some of the largest technology companies in the world, aren’t included in the Technology Select Sector Index; however, Visa and MasterCard are two of the top five holdings.
To understand how some of the largest technology companies are not included in this “technology” focused index and the related ETF, XLK, you have to understand the creation of the GICS. The GICS was launched by MSCI Inc. and S&P Global Inc. which altered the classification of public companies. In September 2018, GICS single-handedly changed technology index investing and by extension the related ETFs.
GICS expanded what was previously the Telecommunications Services sector to include media and entertainment stocks that were previously included in the Consumer Discretionary sector and internet company stocks that were previously included in the Information Technology sector. This new Telecommunications Sector was renamed Communication Services. The Technology Select Sector Index (related ETF: XLK) is limited to companies classified only as Information Technology. As a result, that index (related ETF: XLK) includes companies classified as IT Services which includes Visa, MasterCard, and Accenture and does not include key FANG stocks such as Facebook, Netflix, and Alphabet, which are now included in the Communications Services sector.
It is worth noting that Amazon, a global leader in e-commerce and cloud computing, is in the Consumer Discretionary Select Index and not the Technology Select Sector Index; it is also not included in the newly-formed Communications Services Select Index. In addition, Alibaba often referred to as the “Chinese Amazon” due to its dominance in its respective businesses, is not included in any of the “Select” indices because it is not a U.S. stock. If you are trying to invest in FANG or FAANG with Select Sector products, you would need an allocation to three different indices to do so.
Breakdown of top 10 holdings of Select Sector Indices & NYSE FANG+
(Click on image to enlarge)
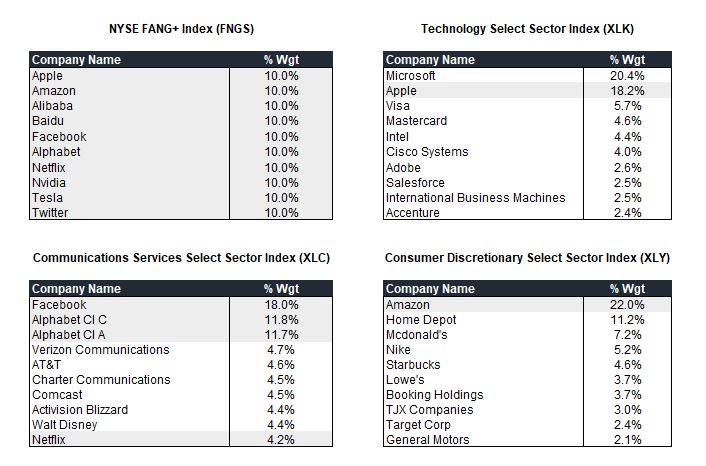
Source: Bloomberg, index data as of 09/20/2019. The highlighted companies are members of the NYSE FANG+ Index on that date.
“Technology indices” such as the Nasdaq-100 Index (related ETF: QQQ) and the Technology Select Index (related ETF: XLK) are missing some of the world’s largest and most dominant technology companies. Here is a breakdown of the NYSE FANG+ constituents within the two largest technology-related indices in the U.S.
(Click on image to enlarge)
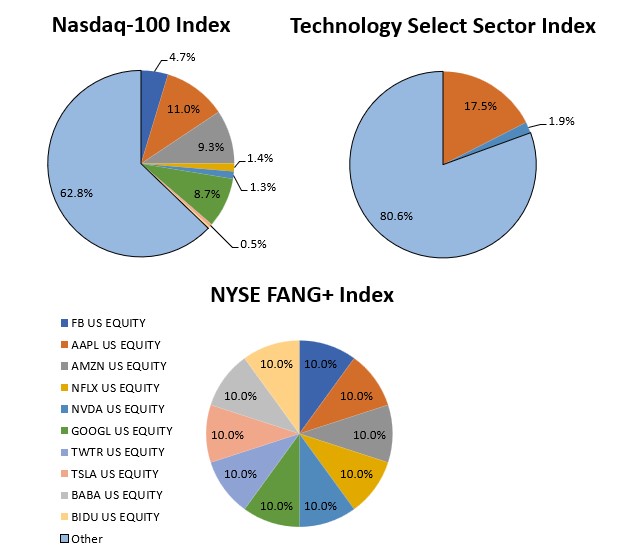
Source: Bloomberg, index data as of 09/20/2019. Weightings of constituents of the NYSE FANG+ Index inside of the NYSE FANG+ Index, the Nasdaq 100 Index, and the Technology Select Sector Index as of the last rebalance date of the NYSE FANG+ Index, 09/20/2019.
Recently, the equity markets have been heading higher helped by strong earnings from global tech leaders such as Apple, Alphabet, Facebook, Baidu, and Alibaba. If all technology indices were representative of all the biggest tech names in the world, then each index would be heading higher. Below is the Q4 2019 performance of the NYSE FANG+ Index relative to the Nasdaq-100 Index, the Technology Select Sector Index, and the S&P 500® Index.
(Click on image to enlarge)
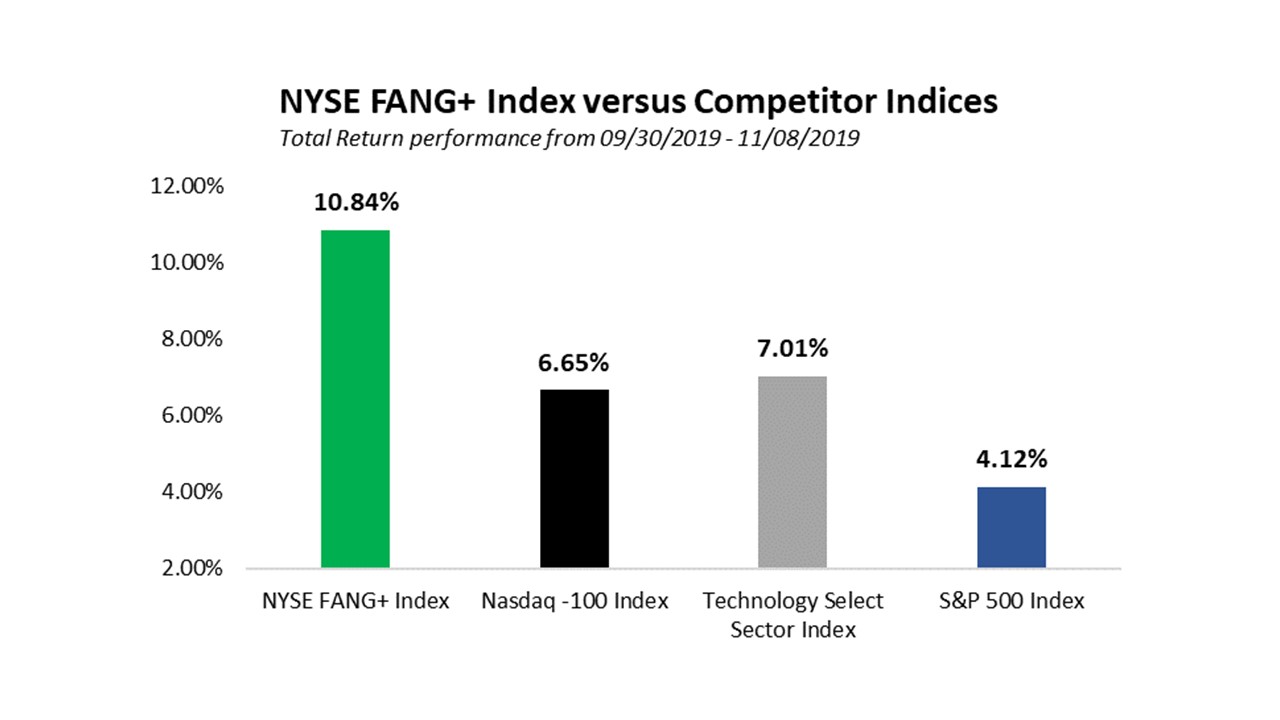
Source: Bloomberg, index data as of 11/08/2019. The NYSE FANG+ Index has outperformed its competitor benchmarks since the beginning of Q4 2019. Past performance is not indicative of future results.
NYSE FANG+ Index versus Competitor Indices since 2014
(Click on image to enlarge)
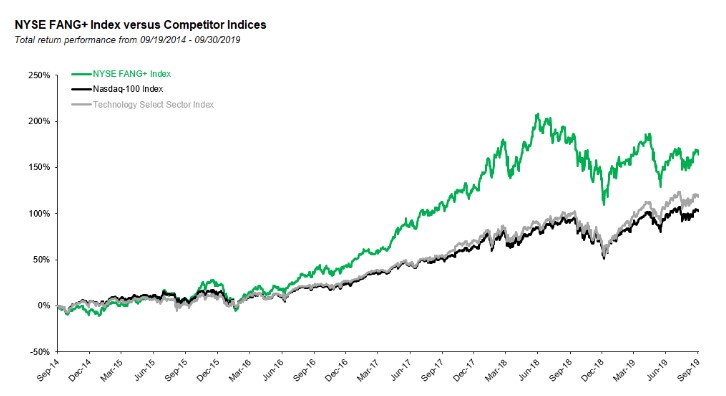
Source: Bloomberg, index data as of 09/30/2019. The NYSE FANG+ Index was launched on 9/26/2017. The NYSE FANG+ Index data prior to that date is hypothetical and reflects the application of the index methodology in hindsight. The hypothetical data cannot completely account for the impact of financial risk in actual trading. Including that hypothetical period, the NYSE FANG+ Index has outperformed its competitor benchmarks since the start of that period. Past performance is not indicative of future results.
So, what does this mean for investors and traders?
If you invest in technology indices or their related ETFs, you have to ask yourself if you are getting the exposure you desire. As illustrated above, the Nasdaq has matured as an exchange, which alters the makeup of the Nasdaq-100 Index and its related ETF, QQQ. Will the exchange continue to evolve and add additional non-technology stocks similar to Pepsi and Starbucks? If it does, it becomes less and less of a technology barometer. If you were a fan of the Technology Select Sector Index and its related ETF XLK, are you still a fan after the recent GICS reclassification? Do you want a technology investment that has a top 5 allocation to credit card companies like Visa and MasterCard?
Prior to FNGS, many investors were limited to investment opportunities that did not capture FANG or FAANG. The Nasdaq-100 Index (related ETF: QQQ) and Technology Select Sector Index (related ETF: XLK) may have been the previous technology standard; however, investors can now access the most innovative names in technology and tech-enabled companies through FNGS.
NYSE FANG+ Index Description:
The NYSE FANG+ Index includes 10 highly liquid stocks that represent the top innovators across today’s technology and internet/media companies. The index’s underlying composition is equally weighted across all stocks, providing a unique performance benchmark that allows for a value-driven approach to investing. While the performance of indices weighted by market capitalization can be dominated by a few of the largest stocks, an equal-weighting allows for a more diversified portfolio.
FNGS: A New Standard in Tech Index Investing
The MicroSectors FANG+ ETNs (FNGS), listed November 13th, 2019 on the New York Stock Exchange, is a first of a kind exchange-traded note (ETN) linked to the NYSE FANG+ Index. We, the team at MicroSectors, are proud to be working with Bank of Montreal, the issuer of the ETNs, to spread the word about the index, including this article.
For more information please visit www.microsectors.com or at info@rexshares.com.
FOOTNOTE:
1 – Market Capitalization calculation is the aggregate market cap of the ten companies that comprise the NYSE FANG+ Index based on the currency USD adjusted valuations.
2 – Annualized revenue calculation is the aggregate annualized revenue of the ten companies that comprise the NYSE FANG+ Index based on the currency USD adjusted valuations.
Disclaimer:
Bank of Montreal, the issuer of the ETNs, has filed a registration statement (including a pricing supplement, product supplement, prospectus supplement and prospectus) with the Securities and Exchange Commission (the "SEC") about the offering to which this article relates. Please read those documents and the other documents relating to the ETNs that Bank of Montreal has filed with the SEC for more complete information about Bank of Montreal and the ETNs. These documents may be obtained without cost by visiting EDGAR on the SEC website at www.sec.gov. Alternatively, Bank of Montreal, any agent or any dealer participating in these offerings will arrange to send the pricing supplement, product supplement, prospectus supplement and the prospectus if so requested by calling toll-free at 1-877-369-5412.
