


“You can’t expect that big of a gain in the next year.”
My mom had just switched her 401(k) account to the best performer over the past year. It was a small-cap fund up 20%.
And the words that immediately came out of my mouth were: “You can’t expect that big of a gain in the next year.”
She made the switch a few months before, and was already up $5,000 in her portfolio since then — more than she gained the entire last year.
Needless to say, she was proud when she told me, but a little shocked when I blurted that out.
Past performance is not a guarantee of future results. That’s a note on every prospectus to any fund, and it’s the truth.
In fact, following past performance tends to lead to an underperformance in the future — and this time is no different.
The Rule of Thumb
According to analysts at Goldman Sachs, the next 10 years are likely to underperform even our usual 10%-a-year return expectations. Ten percent a year is the rule of thumb that we use as the S&P 500’s growth rate.
But as you are about to see, that 10% isn’t always the case, depending on where your starting point is.
Goldman Sachs created a chart of the annualized returns over 10 years, in relationship to where the CAPE ratio (cyclically adjusted price-to-earnings) is at. The CAPE ratio is a common method of analyzing stock market valuations, and is an adjusted P/E ratio, which is the most common valuation measurement.
Currently, it is near its highest historical levels.
Here’s the chart:
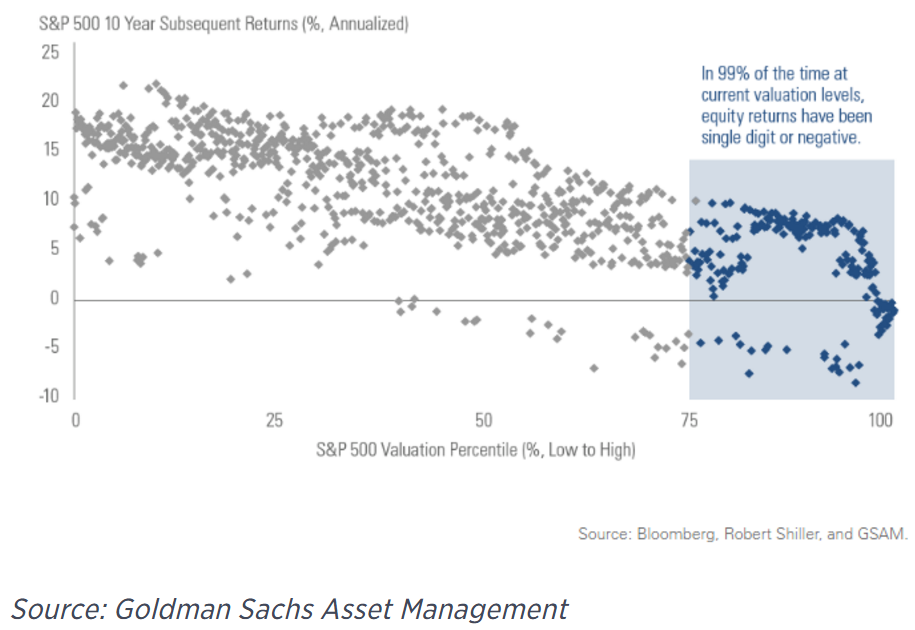
From left to right, the CAPE P/E ratios are getting higher, as noted on the bottom of the chart. From top to bottom, that depicts the returns, notated on the left of the chart.
You can easily notice the downward slope from the left to the right with the scatter plots.
The far right, between the 75th and 100th percentile of valuations, is what we are talking about today.
In 99% of the time that the S&P 500 has been at current valuation levels, the annualized returns over the next decade have been in the single digits.
A Unique Profit-Making Strategy
Sounds like subpar returns are in our future.
That is, if you simply own the S&P 500 Index.
However, that’s not why you read our newsletters, or spend hours researching stocks and strategies on the Internet.
We strive to generate better returns than you could achieve from owning the S&P 500. We may not outperform it on certain months, maybe not even over a specific six-month pattern, but over a year or so, we ultimately have to keep outperforming the market.
Otherwise, you simply wouldn’t use us — you would just buy the S&P 500.
So, if you’re like my mom and are seeking gains like we have seen since 2009, then you need to have a strategy to sidestep the modest performance expected out of the S&P 500 over the next decade.
A unique profit-making strategy is the best way to do so.
Regards,
Chad Shoop, CMT
Editor, Automatic Profits Alert
