


Summary
- A broad stock index is influenced by consumer demand in the United States.
- Consumption changes based on the amount of disposable income left with middle class after spending on basic needs.
- The author has utilized disposable income as a basis to predict the stock market for over 10 years.
A vast majority of US economy is driven by consumer spending. Consumer demand is increased or decreased based on the ability of an average middle-class American to spend on discretionary items beyond the basic needs of housing, food and fuel. Interest rates play a large part, as consumers can leverage up with lower interest rates and vice versa.
Here are some of the factors impacting Americans this year:
Trump Tax Law Impact
Nearly 80% households in US have an income of less than $100K who would mostly benefit from the Trump Tax law, but 20% have incomes above $100K. Those living in high state tax states would be adversely impacted by the $10K limit of deduction on state tax plus property tax.
Home equity, which has historically helped in a large amount of spending (used by approximately around 40% of all houses), would no longer be tax-deductible. This would negatively impact around 25% of households. Though standard deductions have increased, but the itemized deductions have been removed / reduced.
Earlier, people could sell their homes after 2 years and use the capital gains free of taxes. Now they have to wait for 5 years.
I estimate it would be overall between zero and negative 1% impact of the Trump Tax laws on the income of average middle-class families in 2019.
Elephant in the Room, Declining Home Prices
Due to the increase in interest rates, Trump Tax laws and inflation, home prices have started cooling in 2018. Housing prices have both beneficial as well as negative impact on consumers. While people recently buying homes have to shell out higher monthly payments when prices go up and the rents generally increase accordingly, older homeowners get access to additional home equity when prices go up. Additional home equity increases their confidence and ability to spend more. The United States has around 100 million homes, and 6 million homes are sold every year. 40% people who are renting get impacted, as rents increase when home prices increase, though not in the same ratio. However, the ability to dip into their home equity increases the purchasing ability of homeowners when home prices go up.
The average increase in home prices in 2018 was around 2%. In 2019, I expect the home prices to slightly decline in 2019 (between zero and -2%). The most impacted would be the ones in high property tax states like NY, NJ and CA.
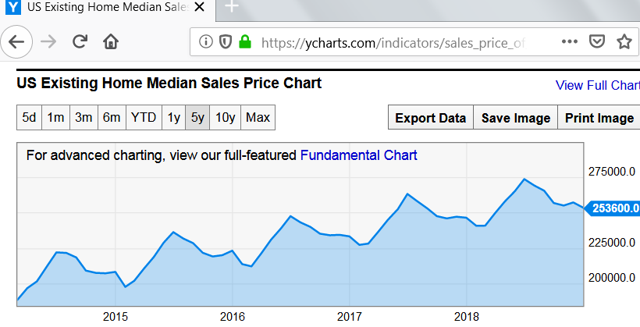
(Reference: YCharts)
Wages vs. Inflation
The dollar has been strong compared to other countries, and despite the US increasing tariffs on imports, countries like China and India have little choice but to bend in trade negotiations if they want to save their exports to the US.
If wages increase faster than inflation, consumers can spend more, and vice versa. In this global economy, knowledge-based jobs can be outsourced easily to other countries, and therefore, wage increases have been seen for jobs requiring physical presence and mostly the blue collar workers.
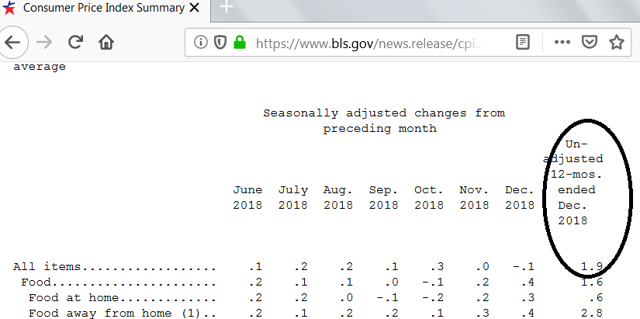
(Reference chart from BLS.gov)
In 2018, CPI increased nearly 2% but inflation decreased after October. In 2019, I expect inflation to be the same at around 2%.
Due to a tightening labor market and the winds of anti-globalization becoming stronger, I expect wages to increase slightly faster this year in 2019, maybe around 4-5%. Compared to inflation, I give it around 2% more.
10-year Treasury yield
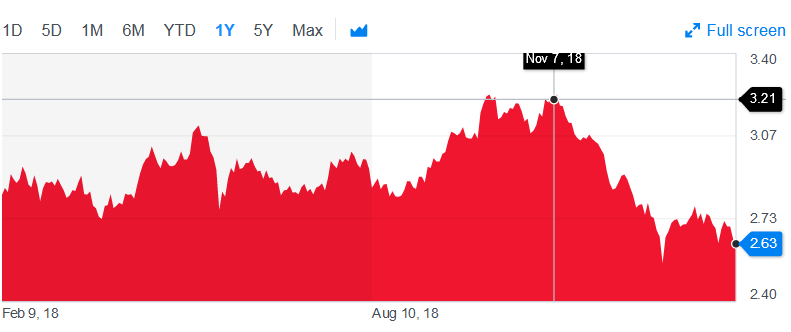
(Reference chart from Yahoo Finance)
In 2018, we witnessed interest rates higher than 2017, but now the Fed has realized the impact on housing and is loosening its monetary policy again. The 10-year treasury yield has fallen since the beginning of the year. It was 3.2 in November, and it is now around 2.6. I expect it to stay low. For the sake of my calculations, I would use a negative 1% change during the year.
Gas Prices
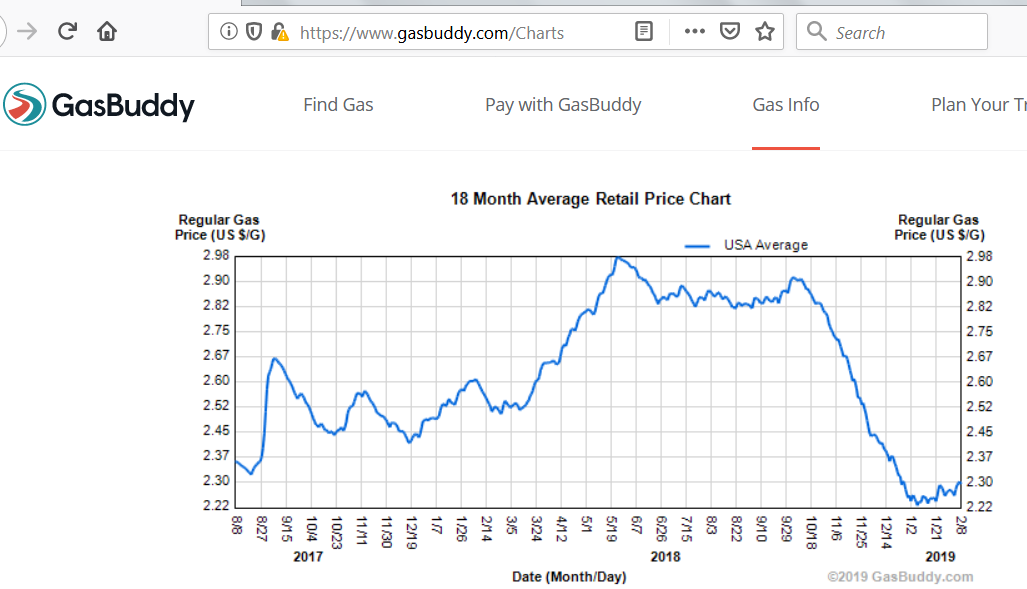
Gas prices in the US in January 2019 were lower than in most of the months in 2018. While President Trump has put pressure on Saudi Arabia/OPEC to keep prices low, OPEC has been going ahead with production cuts. If prices go lower than $30 per barrel, US production becomes economically unattractive and gets reduced, and therefore, prices will again move higher. If prices move higher, US production increases to stabilize the prices. Therefore, gas prices could stay the same for most of the 2019 or slightly increase. I give an increase of around 10% during the year.
Please see below the predictions made using this methodology on Yahoo Finance over the past 10 years:
|
Year |
Link |
|
2009 |
|
|
2010 |
|
|
2011 |
|
|
2012 |
|
|
2013 |
N/A - No article published |
|
2014 |
|
|
2015 |
|
|
2016 |
N/A - No article published |
|
2017 |
|
|
2018 |
Where Will The Dow And S&P Be By The End Of This Year (2018)? |
Calculations
This is a unique year, as home prices have started moving south after nearly 10 years. It would be important to see how much the impact of this is, as historically, a home price decline has led to an economic slowdown (reference the chart in the Disposable Income formula, published in 2014: "Is There A Formula To Predict The Dow, S&P For 2014?").
Ignoring that fact, if we use the Disposable Income formula, we get the following prediction for 2019:
(A) With interest rates declining by 1% during the year, home prices staying the same and the take - home wages increase 1% more than inflation.
|
2019 |
|||
|
Increase |
Factor |
Total |
|
|
Wage Increase (including new tax impact) - CPI Increase |
1 |
3.4 |
3.4 |
|
Gas |
10 |
-0.5 |
-5 |
|
Home prices |
0 |
-0.8 |
0 |
|
10 year*10 year |
-1 |
-7.4 |
7.4 |
|
Home*10 year |
0 |
-1.4 |
0 |
|
Static factor |
20.2 |
||
|
Change=> |
26% |
(B) With interest rates staying the same, but take-home wages increasing 2% more than inflation:
|
2019 |
|||
|
Increase |
Factor |
Total |
|
|
Wage Increase (including new tax impact) - CPI Increase |
2 |
3.4 |
6.8 |
|
Gas |
10 |
-0.5 |
-5 |
|
Home prices |
0 |
-0.8 |
0 |
|
10 year*10 year |
0 |
-7.4 |
0 |
|
Home*10 year |
0 |
-1.4 |
0 |
|
Static factor |
20.2 |
||
|
Change=> |
22.00% |
Conclusion
In other words, the Disposable Income formula suggests that the S&P 500 should be at least 20% higher, which means the index would be around 3100 or higher by the end of the year.
It remains to be seen if the Disposable Income formula would stand against declining home prices.
