


Photo by Michelle Spollen on Unsplash
The Canadian Dollar (CAD) holds firm against the US Dollar (USD) on Tuesday, with the USD/CAD pair trading sideways during the American session to trade around 1.3720. The pair had stabilized earlier in the day as the Greenback attempted a mild rebound, but lost steam despite a stronger-than-expected JOLTS Job Openings report. Market participants remain cautious ahead of the Bank of Canada's (BoC) rate decision on Wednesday, with expectations leaning toward the central bank holding interest rates steady.
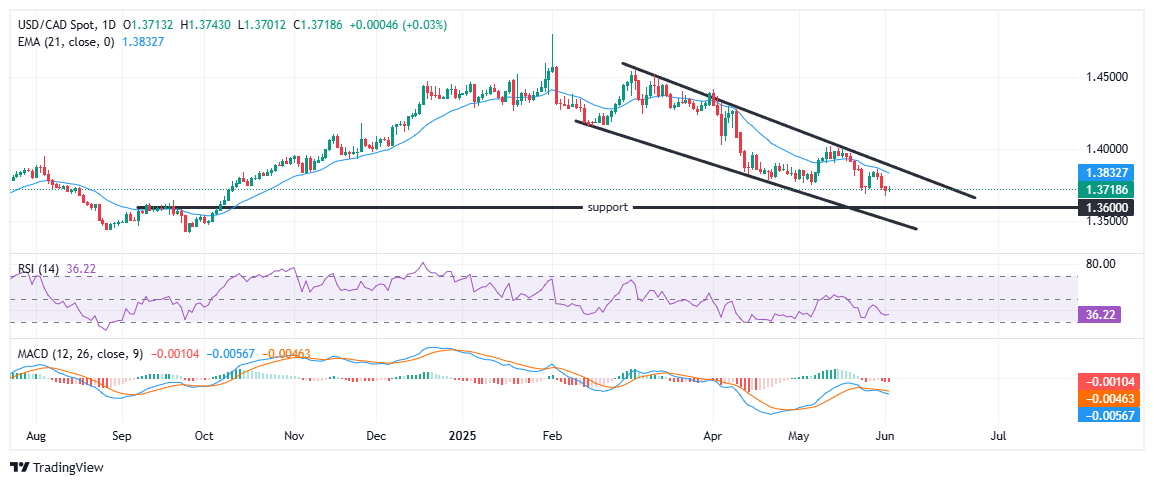
Moving on to the technicals, the broader picture still favors the bears. USD/CAD has been locked in a steady downtrend, carving out lower highs and lower lows within a descending channel since March. On the downside, immediate support is seen around 1.3700, which has emerged as a short-term floor during recent sessions. A sustained break below this level could pave the way toward stronger support near 1.3600, which aligns with the lower boundary of the channel. A clean breach of that zone would likely trigger a fresh wave of selling, potentially exposing the 1.3520–1.3500 area next.
On the upside, any recovery would first need to clear the 21-day Exponential Moving Average at 1.3832 — a dynamic resistance level that has capped recent rallies. A break above the channel top and the 1.3850 region would be a more meaningful signal that bulls are regaining control, possibly opening the path toward the 1.4000 handle.
That said, momentum indicators suggest that the bearish momentum may be starting to fade. The Relative Strength Index (RSI) is currently sitting just above the oversold threshold near 35. While this level isn’t extreme, it does signal that selling pressure could be nearing exhaustion. The RSI has remained below 50 for most of the past month, indicating that sellers have had the upper hand for a while. Some buyers may start to test the waters. Meanwhile, the Moving Average Convergence Divergence (MACD) is still in negative territory, but the histogram bars have been shrinking — a sign that the downward momentum is weakening. This flattening suggests the bears are losing steam, and the pair could be setting up for a short-term bounce if the 1.3700 psychological level continues to hold.
(Click on image to enlarge)
More By This Author:
EUR/USD Pulls Back From Highs With Eurozone Inflation In Focus
Japanese Yen Sticks To Intraday Losses; Downside Seems Limited Amid Hawkish BoJ Expectations
WTI Price Forecast: Oil Prices Climb On Weaker USD, Geopolitical Tension, WTI Stalls Near Key Resistance
