Year End Disinversion: Bull Or Bear Steepening?

Image Source: Pexels
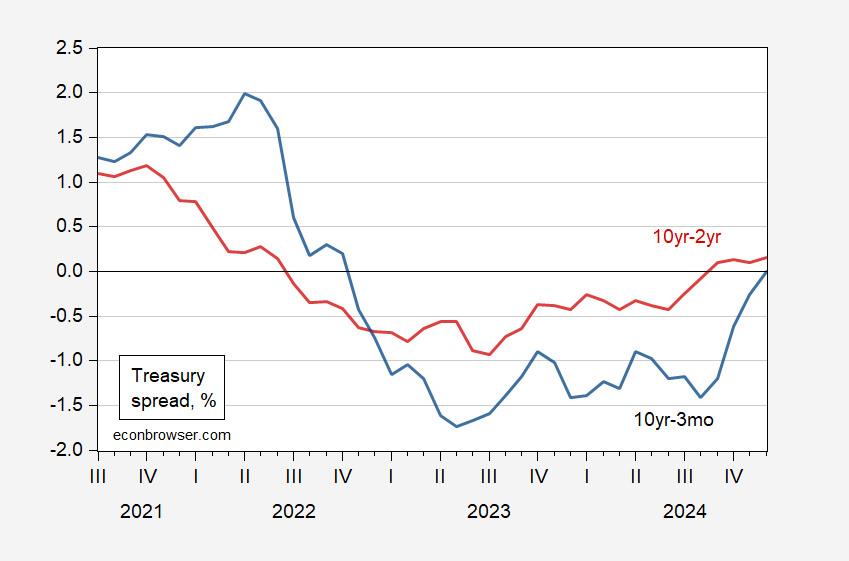
With December 31 data, here’s the picture of term spreads:
Figure 1: 10yr-3mo Treasury spread (blue), 10yr-2yr Treasury spread (red), both in %. Source: Federal Reserve via FRED, author’s calculations.
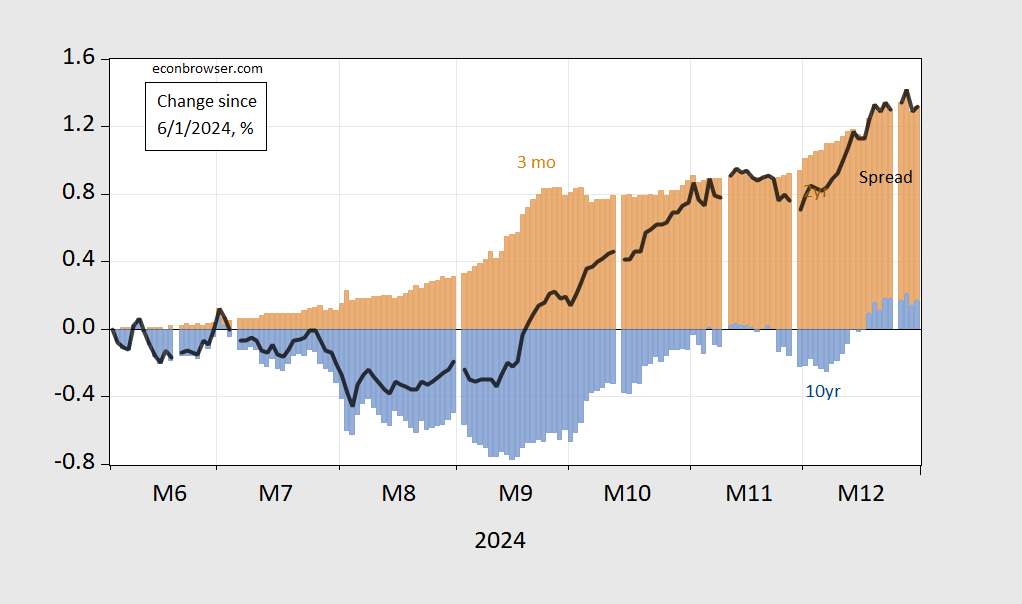
Bull or bear steepening in the 10yr-3mo? Here’s daily data:
Figure 2: Change since June 1, 2024 in 10yr-3mo term spread (bold black), contribution to change from 10 year yield (blue bars), from 3 month yield (tan), all in percentage points. Source: Treasury via FRED, and author’s calculations.
It’s the case that the majority of the disinversion since June 1st is due to the short rate falling, not the long rate rising.
Using a specification incorporating the 3 month change in the spread, a probit model implies 61% probability of recession in 2025M04, compared to 31% using a spread only…
More By This Author:
What If? Thoughts On The No Excess Demand ScenarioRevisiting The Relationship Between Debt And Long-Term Interest Rates
Intra-industry Trade Estimated


