

Image by WorldSpectrum from Pixabay
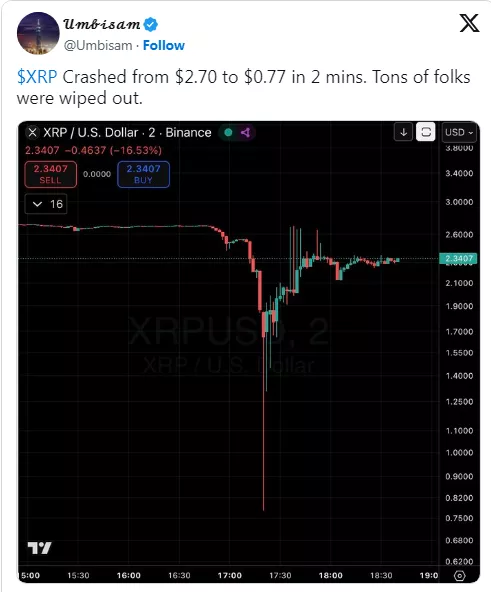
XRP experienced its sharpest one-day decline in recent years on Friday. The token crashed as much as 42% before partially recovering.
(Click on image to enlarge)
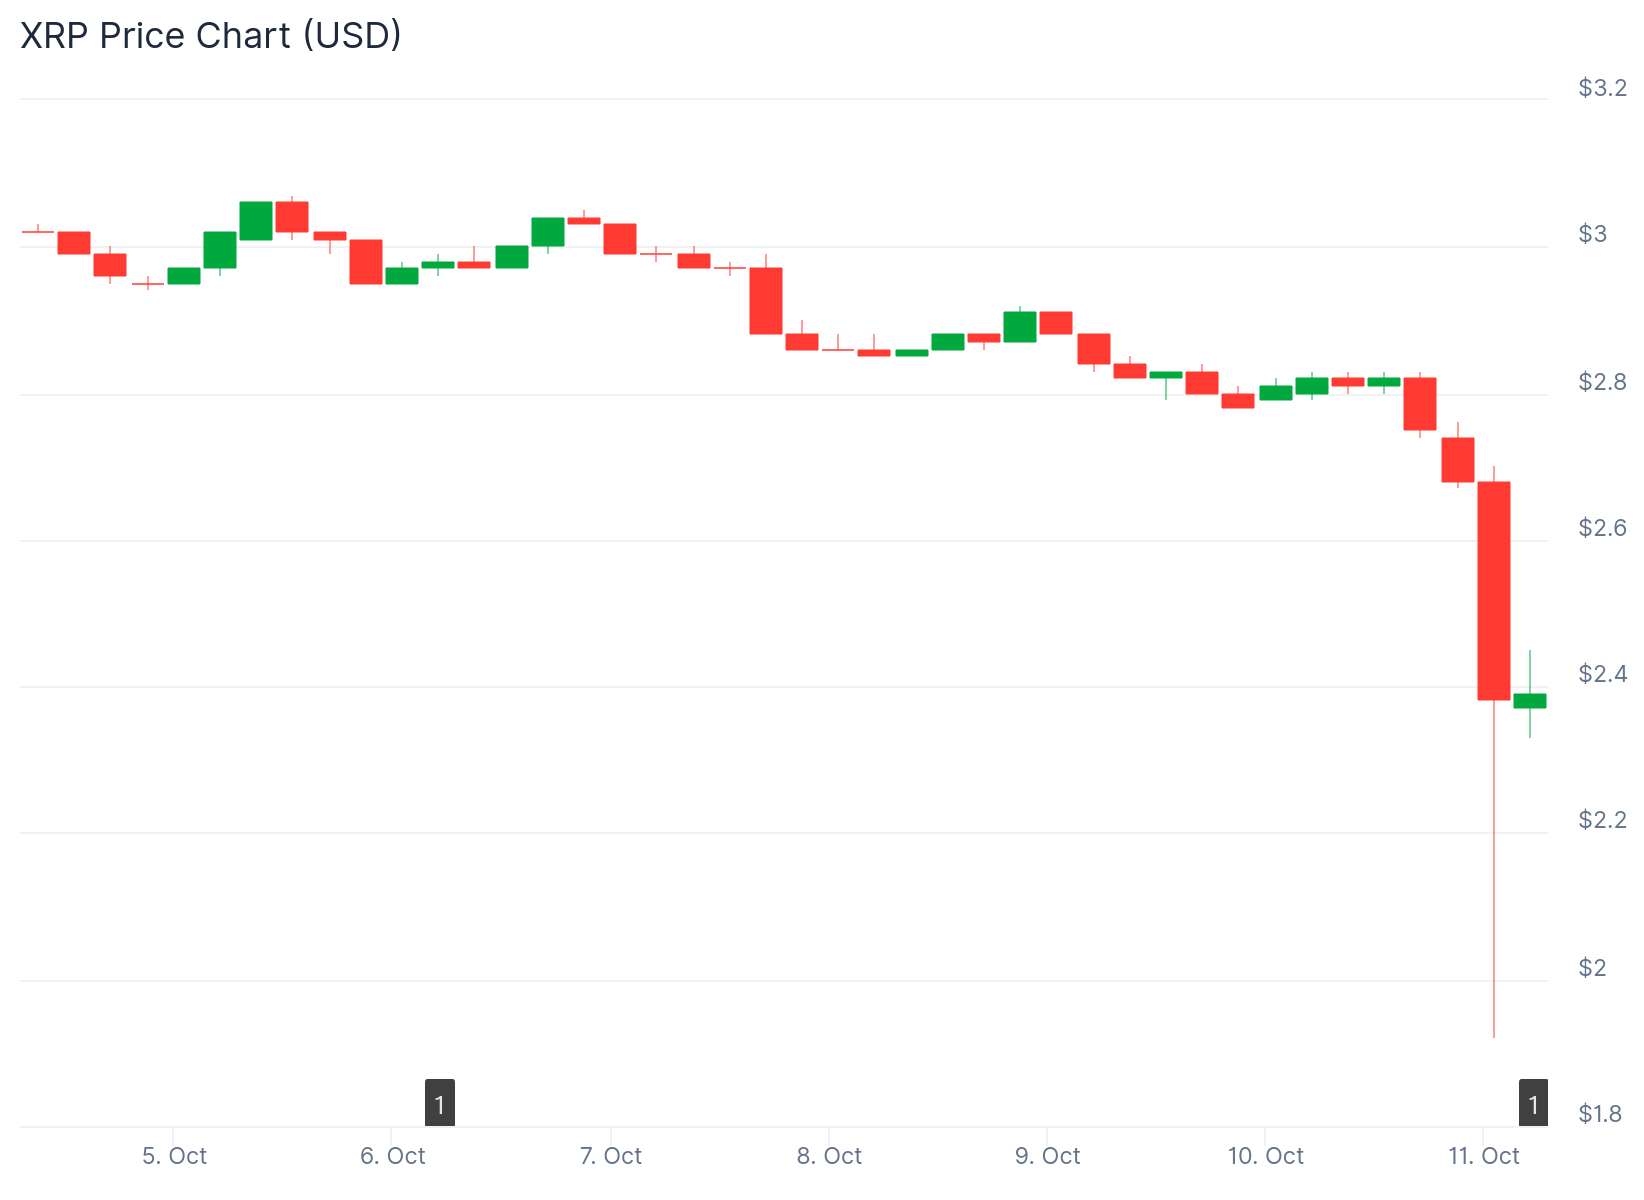
XRP Price
The selloff began with XRP trading near $2.82. Prices then fell to an intraday low of $1.64 during high-frequency liquidation sweeps. The token later stabilized around $2.36.
Trading volumes jumped 164% above the 30-day average. This level of activity signals forced deleveraging across institutional trading desks.
The crash happened between October 10 at 1:00 AM and October 11 at midnight. During this period, XRP posted a 16% daily loss from opening to closing prices.
Intraday volatility peaked at 43%. The heaviest liquidation period occurred between 3:00 PM and 9:00 PM UTC when hourly volume reached 817.6 million.
Futures Markets See Mass Liquidations
Institutional futures open interest dropped from $9.0 billion to $8.85 billion. Long liquidations totaled $21 million while short liquidations reached only $2 million.
This data shows that leveraged long positions were the primary target of the selloff. The $150 million decrease in open interest reflects the scale of forced position closures.
On-chain data reveals that 320 million XRP transferred to exchange wallets over the past week. This movement confirms whale distribution pressure on the market.
JUST IN: $XRP whales are offloading 🐋
— Maartunn (@JA_Maartun) October 10, 2025
Whale Flow (30DMA): -$50M/day.
Sell pressure persists. pic.twitter.com/Hcnys9vCCV
Whale wallets have been withdrawing an average of $50 million per day for the past month. The 30-day moving average of whale flow has remained deeply negative since July.
This persistent selling began when XRP reached its top above $3.60 earlier this year. Large holders used that rally to take profits.
Price Stabilizes After Flash Crash
The final 60 minutes of trading saw stabilization. Prices moved from $2.31 to $2.38, gaining 2% as algorithms broke through $2.35 on sustained buying.
(Click on image to enlarge)
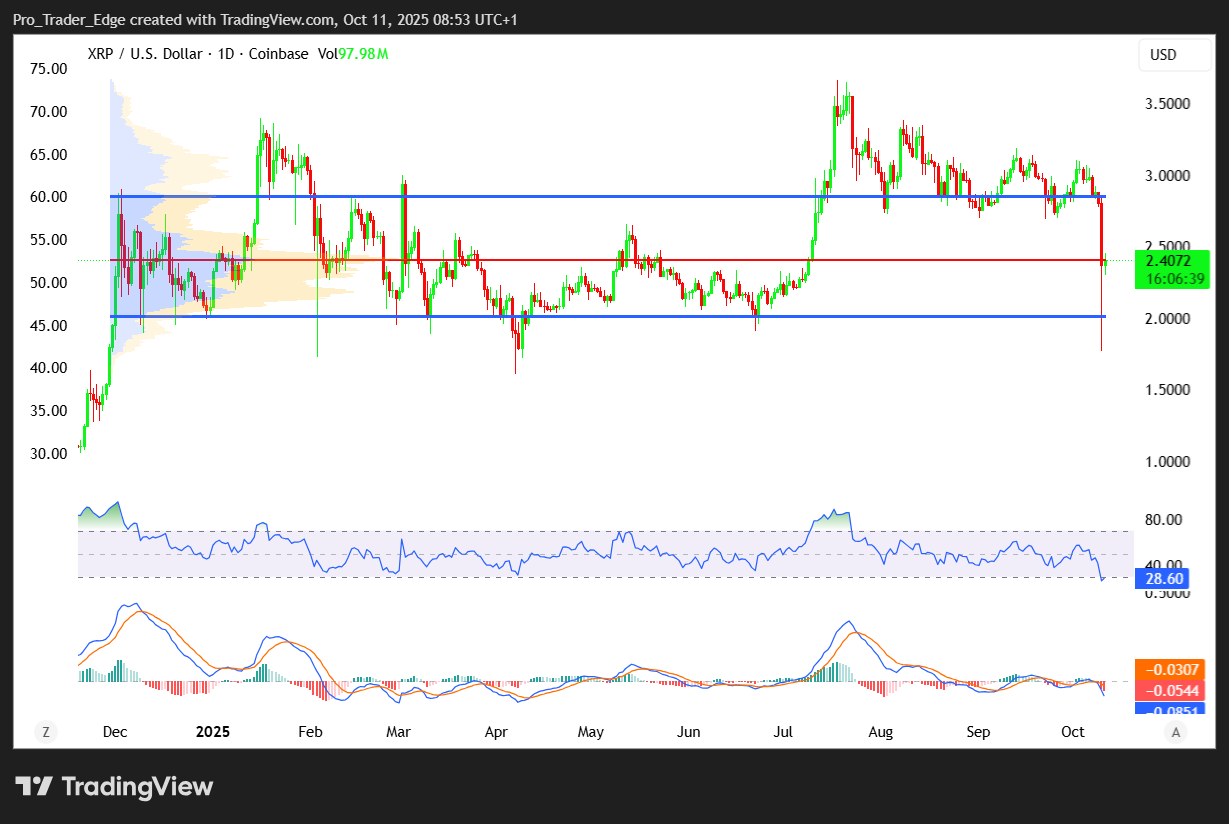
Source: TradingView
Late-session buying brought accumulation volumes exceeding 12 million in the final 15 minutes. Long-term holders appear to be adding positions below $2.40.
Support has formed around $2.30 to $2.35. Extended downside risk exists to $2.22 if trading volume decreases.
Resistance sits at $2.84 to $2.90. A close above $2.90 would be needed to regain technical structure. The macro breakout trigger level is at $3.05.
The 75-day symmetrical triangle broke to the downside during the crash. RSI levels are near multi-month lows while volatility bands are expanding.
Technical analysts identify $2.73 as a key support level within a parallel channel pattern. The token has been trading between two parallel trendlines over recent months.
Traders are watching whether the $2.30 support zone will attract sustained whale accumulation. They are also monitoring the rebuild of open interest following the $150 million contraction in derivatives markets.
More By This Author:
Exxon Mobil Corp. Stock: Enters LNG Marine Bunkering Market With Two New Vessels To Cut Emissions
TSMC Stock Drops Amid U.S. Chip Scrutiny And China Export Rules
Intel Stock Slips As Panther Lake Ushers In The 18A Era Of U.S. Chipmaking And Arizona Fab Expansion


Comments
Log in or sign up to join the conversation.