

Image Source: Pexels
Compared against CBO, GS tracking:
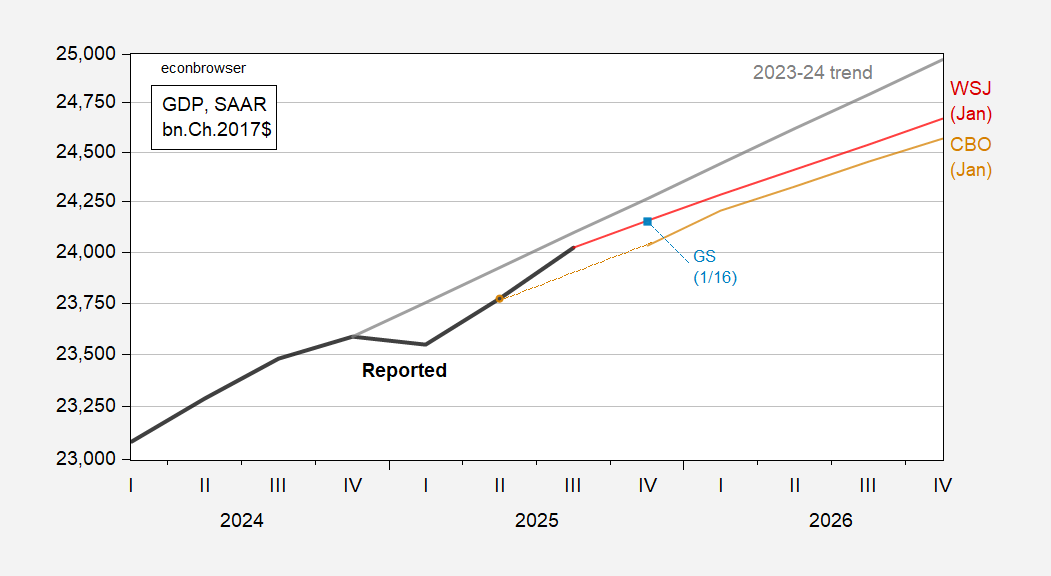
Figure 1: Reported GDP (bold black), WSJ mean (red), CBO projection (tan), and GS tracking of 1/16 (light blue square), and 2023-24 stochastic trend (gray), all in bn.Ch.2017$, SAAR. Source: BEA, CBO, WSJ, and Goldman Sachs.
More By This Author:
Economic Consequences Of IEEPA Tariff StrikedownReal Retail Sales And The Business Cycle
Groceries Rose 9% M/M (Annualized) In December


Comments
Log in or sign up to join the conversation.