

Image Source: Pexels
GDPNow for Q4 at 5.1% is considerably higher than Goldman Sachs at 3.1%, and St. Louis Fed at essentially zero.
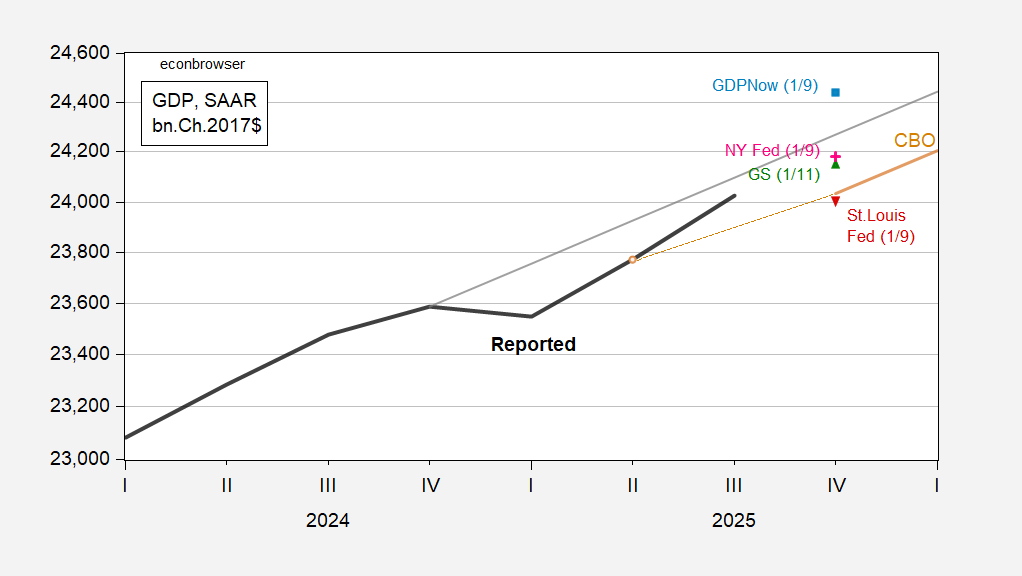
Figure 1: GDP as reported (bold black), CBO January projection (tan), 2023-24 stochastic trend (gray), Goldman Sachs of 1/11 (green triangle), GDPNow of 1/9 (light blue square), NY Fed of 1/9 (pink +), St. Louis Fed (inverted red triangle), all in bn.Ch.2017$, SAAR. Source: BEA, CBO, Goldman Sachs, Atlanta Fed, NY Fed, St. Louis Fed, and author’s calculations.
Employment indicators continue to diverge from output indicators, most recently monthly GDP:
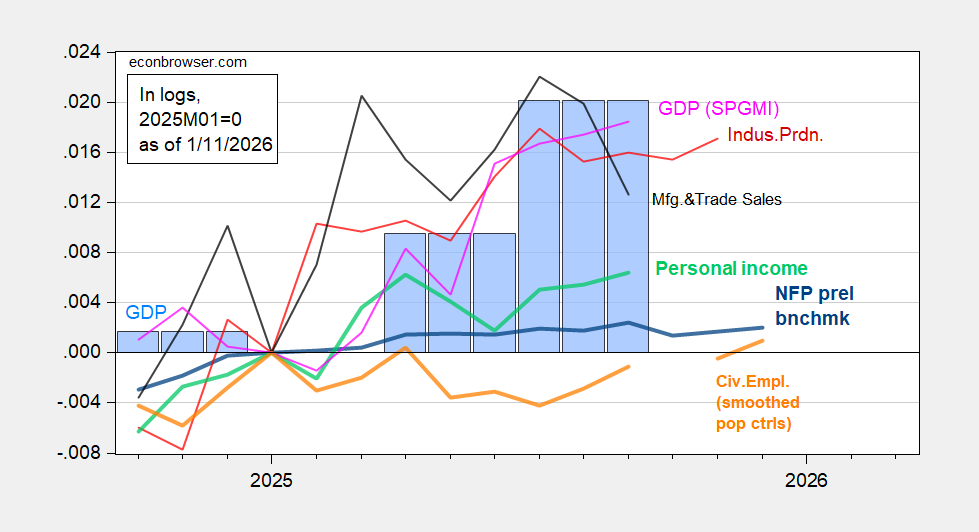
Figure 2: Implied NFP preliminary benchmark revision (bold blue), civilian employment with smoothed population controls (bold orange), industrial production (red), personal income excluding current transfers in Ch.2017$ (bold light green), manufacturing and trade sales in Ch.2017$ (black), and monthly GDP in Ch.2017$ (pink),GDP (blue bars), GDP (blue bar), all log normalized to 2025M01=0. Source: BLS, ADP, via FRED, Federal Reserve, BEA 2025Q3 initial release,S&P Global Market Insights (nee Macroeconomic Advisers, IHS Markit) (1/6/2026 release), and author’s calculations.
Employment is flat (both measures) since the beginning of the year, while September monthly GDP is about 1.8% above January level.
More By This Author:
Six Measures Of Nonfarm Payroll Employment: All Below PeakBusiness Cycle Indicators: Employment Growth Slows
Change In Federal Debt Held By The Public, Trump 1.0, 2.0, And Biden


Comments
Log in or sign up to join the conversation.