
Why Volatility Has Drained On The Daily Chart For Bitcoin
As traders and investors, we are all familiar with the concept of volatility which at its simplest level is nothing more than the compression of time. Price action that might normally occur over hours happens in minutes or seconds. However, if there is one market in particular that exhibits greater levels of volatility than any other, and for many reasons, it is the cryptocurrency market.
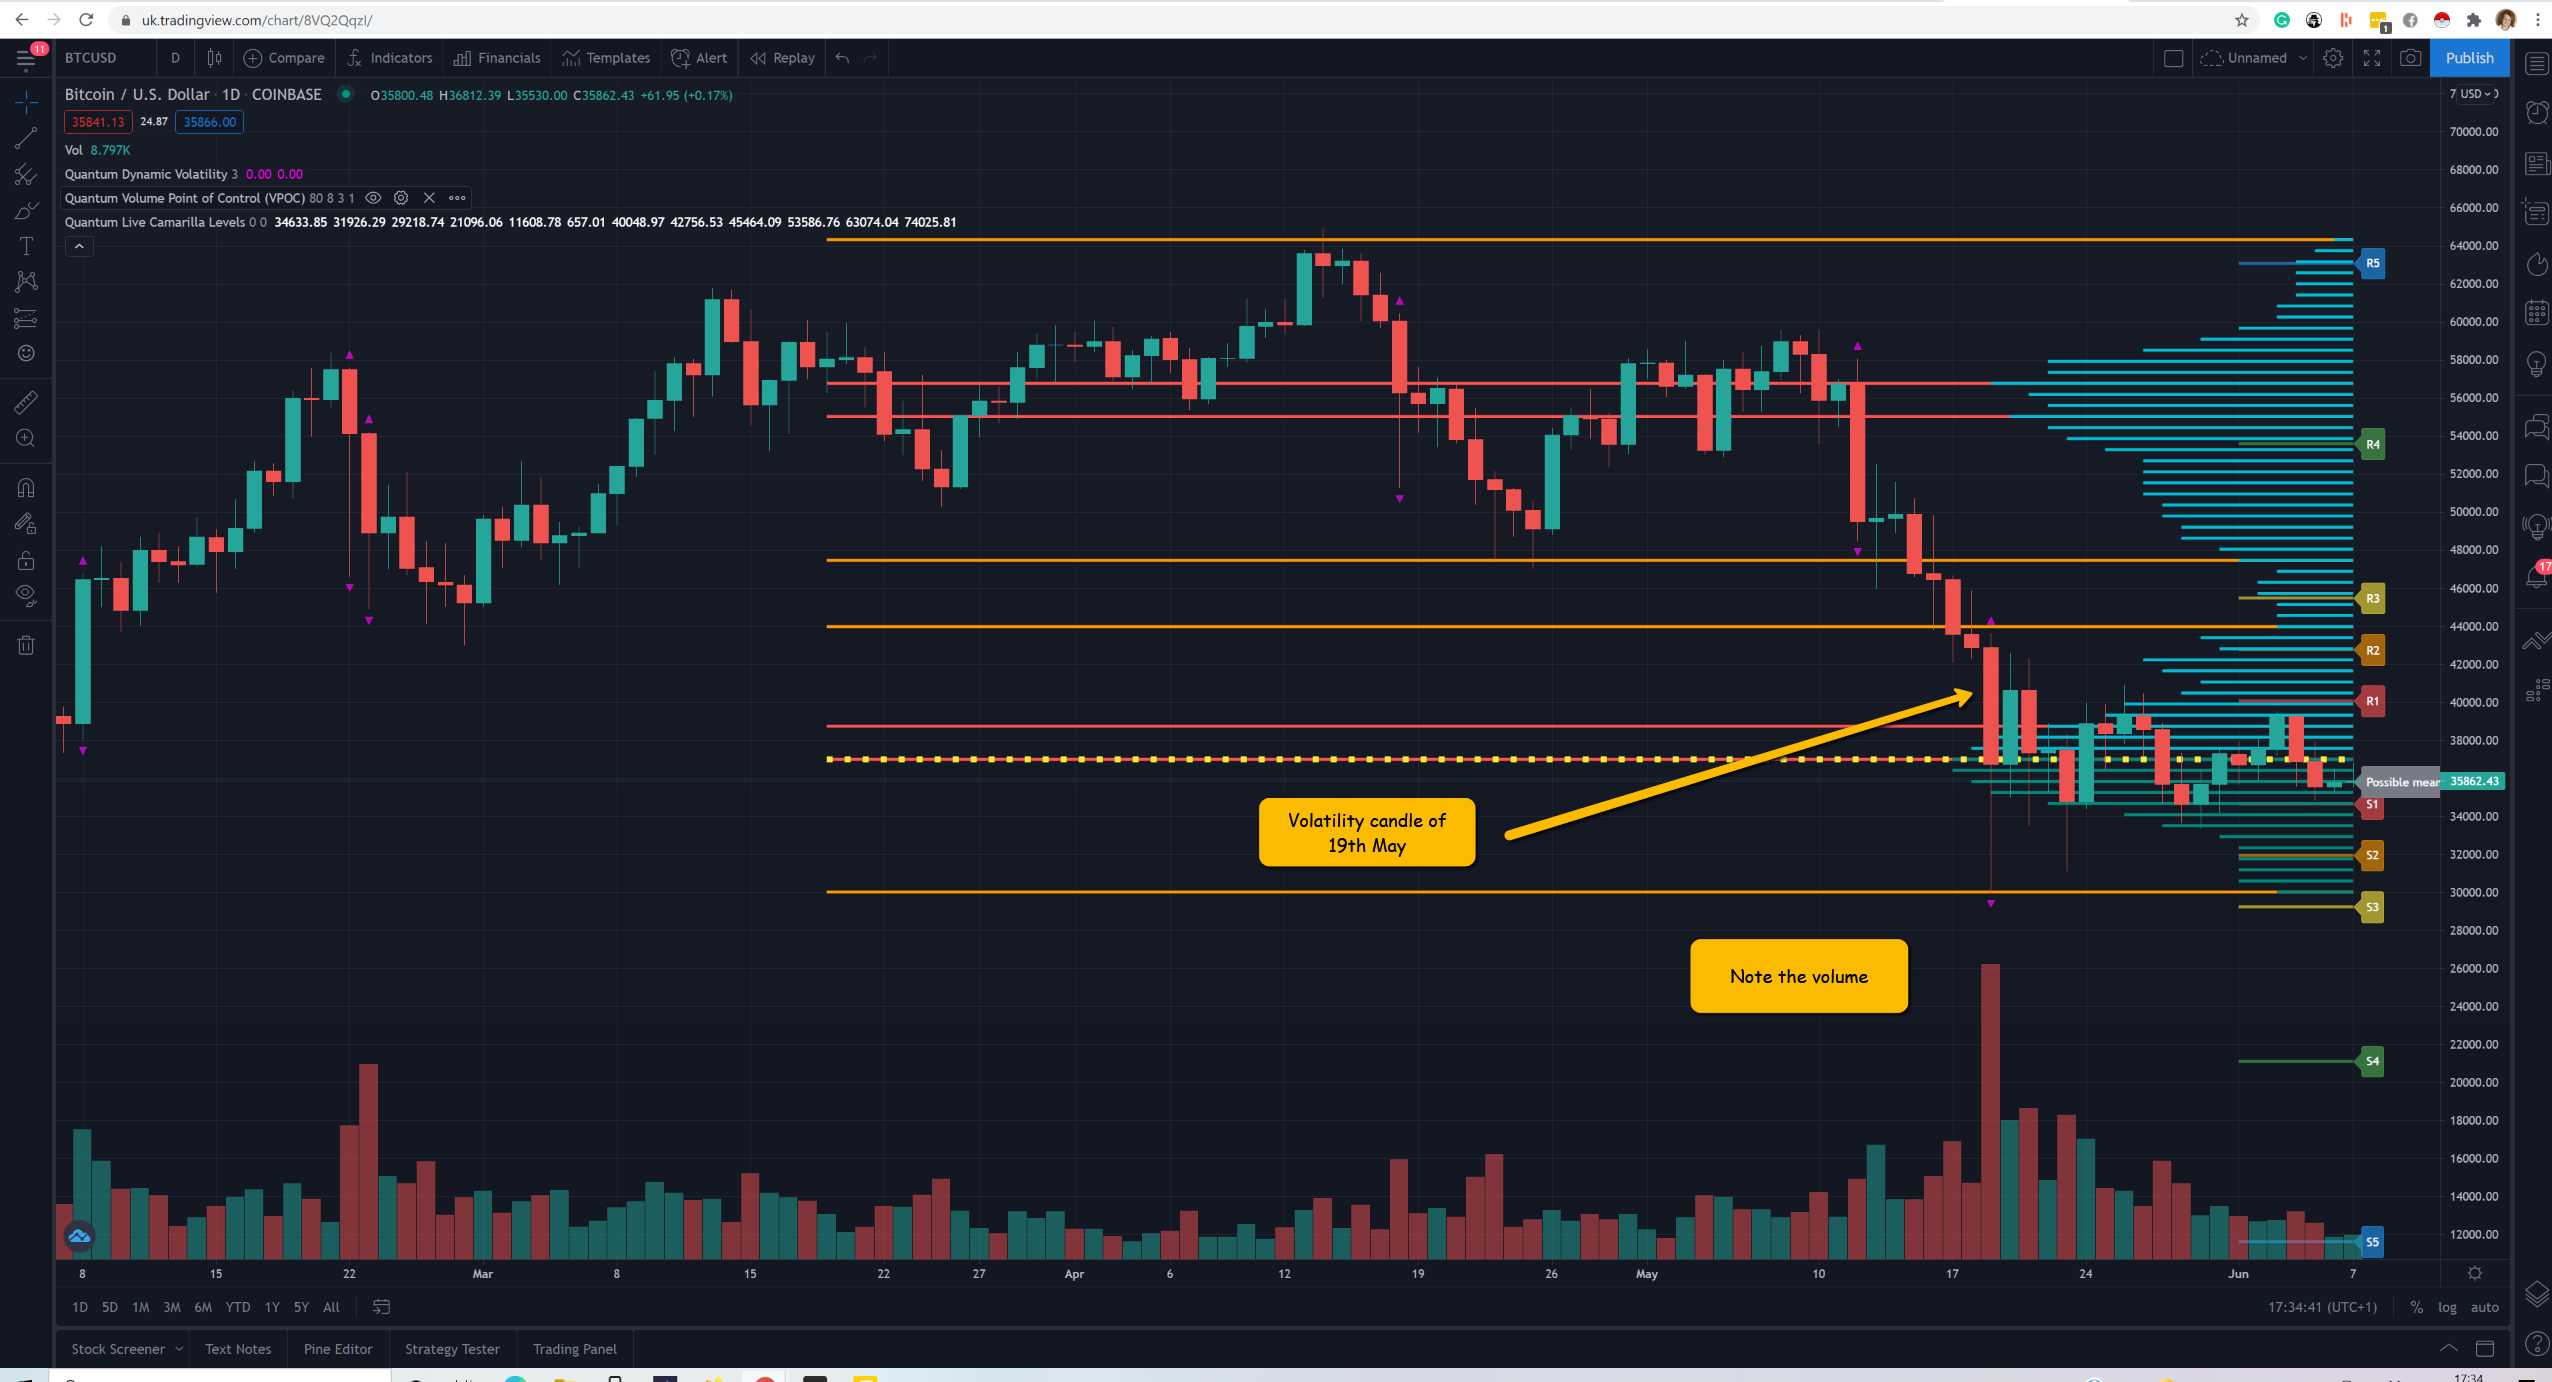
However, for Bitcoin, the last three weeks have seen volatility drain away as the price congests in a relatively narrow range around the 36,000 to $37,000 area. The question is why and can be answered by considering the daily chart on TradingView and in particular the price action of the 19th May. Two significant events occurred on that day. First, we had the volatility indicator trigger with the small purple triangles at the top and bottom of the candle. What this indicator reveals is the moment the price action moves outside the average true range (ATR) for the market and timeframe and is triggered in real-time. As a result, we can expect one of two things to happen. Either a reverse in the trend or congestion within the spread of the candle and it is the latter we are seeing at present. Second, this volatile candle was associated with extreme volume, and given the depth of the wick to the lower body of the candle along with the volume, we can infer this is buying based on the first principles of volume price analysis with further buying arriving four days later.
So what next? For now, it is a question of being patient and wait for the price action to clear the volatility candle, and only then are we likely to see a trend develop. This analysis is further reinforced by the fact Bitcoin is trading at the volume point of control and between the R1 and S1 levels on the Camarilla levels indicator aka the buffer or neutral zone thereby confirming the current congestion phase. The current stagnation in the price action will end once Bitcoin breaks through either the key S3 & R3 levels which are just beyond the high and low of the volatility candle itself.
(Click on image to enlarge)
Disclaimer: Futures, stocks, and spot currency trading have large potential rewards, but also large potential risk. You must be aware of the risks and be willing to accept them in order to invest in ...
more

