
Following futures positions of non-commercials are as of January 4, 2022.
10-year note: Currently net short 276.9k, up 63.6k.
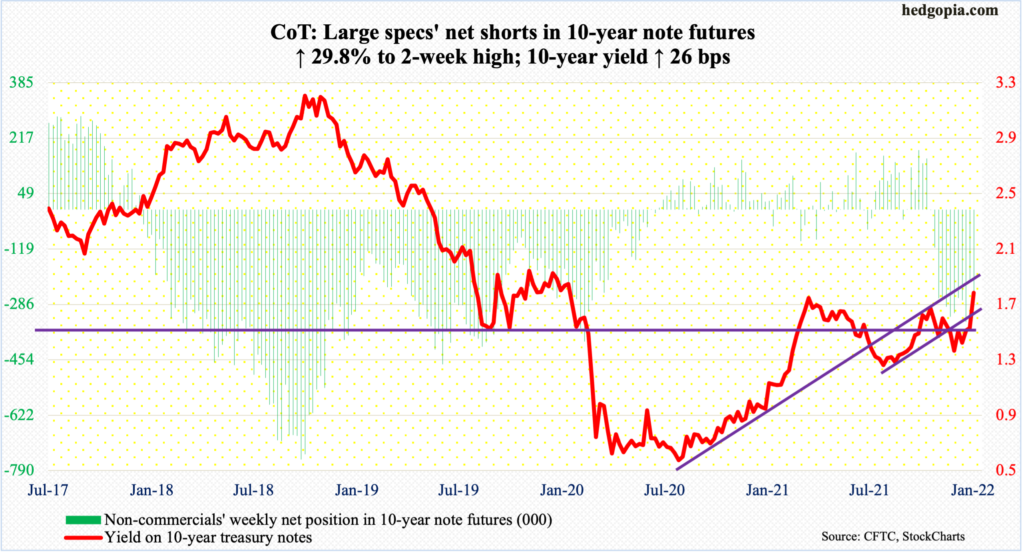
The December 14-15 FOMC minutes, out Wednesday, revealed that the Fed was more determined to snatch the punch bowl away from the ongoing party in a whole host of assets, not the least of which is equities. The S&P 500 bottomed in March 2020 at 2192 and ticked 4819 this Tuesday – for a 120-percent surge in less than two years.
Equities – and the US economy – responded to a sea of fiscal and monetary stimulus. On the latter, the Fed held $4.2 trillion in early March 2020, which by this week had ballooned to $8.8 trillion. To facilitate this, the central bank singlehandedly focused on its ‘maximum employment’ mandate. ‘Price stability’ – the other mandate – was ignored, even encouraged. Fast forward nearly two years, the dynamics have changed. The job market has tightened, even as inflation has jumped to decade highs.
This has forced the Fed to sound more hawkish than the markets. Until recently, it was the other way round. It is now keen on ending its bond-buying program as soon as possible, so it could begin to raise rates. Just the other day, James Bullard, St. Louis Fed president, said a rate hike could come as soon as March and that balance sheet runoff could take place in tandem with rate hikes.
The concept of a reduction in the Fed’s balance sheet is a new one. Undoubtedly, the Fed is sitting on loads of assets, which now makes up 38 percent of the nominal GDP; before the onset of the 2008-2009 financial crisis, this was less than seven percent.
As things stand, it is hard to tell what normal is. But as far as equities are concerned, even a hint that the Fed is not only tapering its bond purchases but also toying with the idea of shrinking its pool of assets can be troubling. And we are beginning to see some early signs of that.
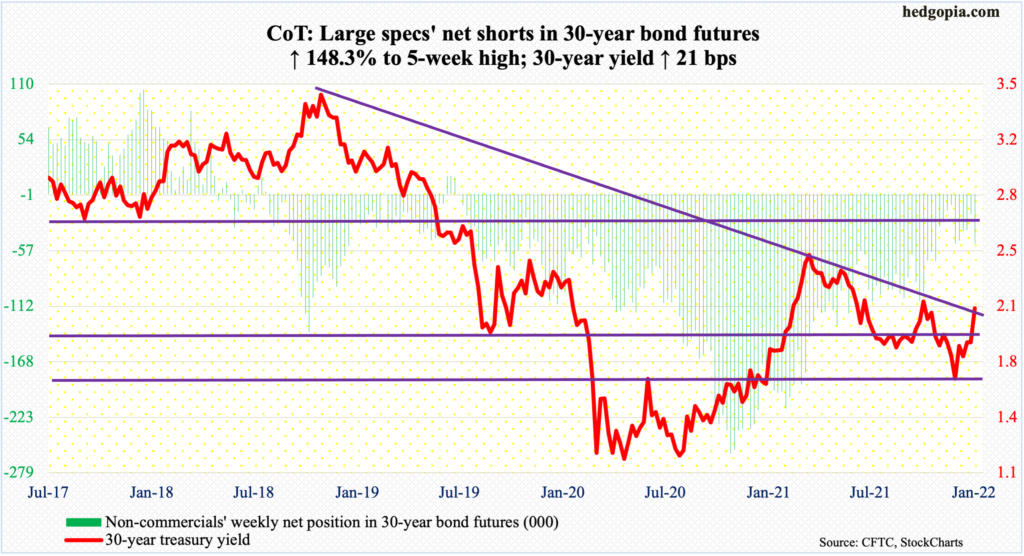
30-year bond: Currently net short 49.6k, up 29.6k.
Major economic releases for next week are as follows.
The NFIB optimism index (December) is due out on Tuesday. Small-business job openings dropped a point month-over-month in November to 48. September’s 51 was a new record, which was more than double the post-pandemic low of 23 from May 2020.
The consumer price index (December) is scheduled for Wednesday. Headline and core consumer prices rose 0.8 percent and 0.5 percent m/m in November. In the 12 months to November, they respectively grew 6.8 percent and 4.9 percent – steepest since June 1982 and June 1991, in that order.
Thursday brings the producer price index (December). November producer prices increased 0.8 percent m/m and 9.6 percent in the 12 months; over the same period, core prices rose 0.7 percent and 6.9 percent respectively.
On Friday, retail sales (December), industrial production (December) and the University of Michigan consumer sentiment index (January, preliminary) will be published.
November retail sales rose 0.3 percent m/m to a seasonally adjusted annual rate of $639.8 billion – a new record. In April 2020, sales dipped as low as $409.8 billion.
US capacity utilization rose 0.5 percent m/m in November to 76.8 percent – a two-year high.
Consumer sentiment grew 3.2 points m/m in December to 70.6. November’s 67.4 was a decade low.
WTI crude oil: Currently net long 367.1k, up 8.4k.
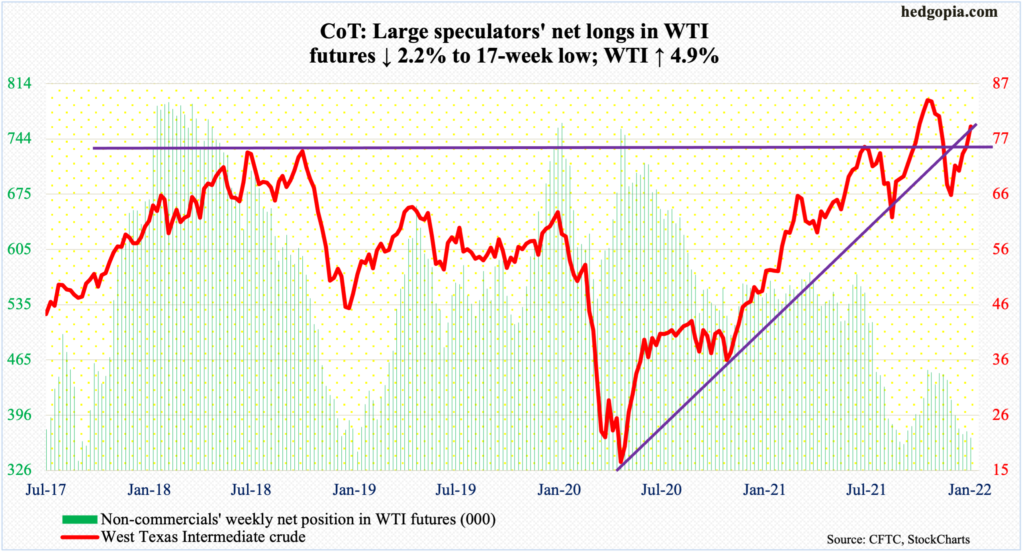
Between October 25 and December 2 last year, WTI ($78.90/barrel) declined from $85.41 to $62.43. A 78.6-percent Fibonacci retracement comes to $80.49. On Friday, the crude ticked $80.47. This level could induce selling. If bids overwhelm offers, then oil bulls have a good shot at the October peak, which was a seven-year high.
Else, the daily remains overbought. There is decent horizontal support at $76-$77, which goes back 15 years.
In the meantime, as per the EIA, US crude production in the week to December 31 was unchanged week-over-week at 11.8 million barrels per day. Crude imports dropped 875,000 b/d to 5.9 mb/d. As did crude stocks, which fell 2.1 million barrels to 417.9 million barrels. Gasoline and distillate stocks, however, rose – up 10.1 million barrels and 4.4 million barrels to 232.8 million barrels and 126.8 million barrels, in that order. Refinery utilization edged up one-tenth of a percentage point to 89.8 percent.
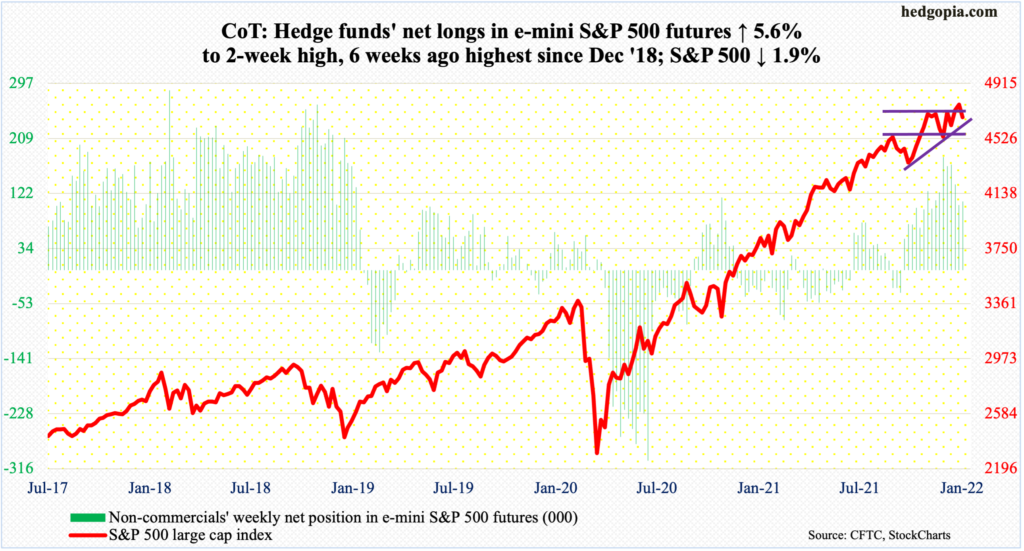
E-mini S&P 500: Currently net long 109k, up 5.7k.
Money is pouring in. In the week to Wednesday, US-based equity funds took in $9.2 billion, for a three-week haul of $46.3 billion (courtesy of Lipper). SPY (SPDR S&P 500 ETF), VOO (Vanguard S&P 500 ETF) and IVV (iShares Core S&P 500 ETF) in the week to Wednesday pulled in $5.3 billion; this was the sixth consecutive positive week for a total take of $30.5 billion (courtesy of ETF.com).
On December 3, the S&P 500 put in a low of 4495 before bids started showing up. By January 4, it reached a new all-time high of 4819. All these fund flows were made good use of; the question is of sustainability.
On December 4, the large cap index (4677) tumbled 1.9 percent to fail breakout retest at 4740s. From bulls’ perspective, the good thing is that they defended the 50-day both Thursday and Friday. But odds favor the average gives way sooner than later. This would open the door to a test of 4540s.
Euro: Currently net short 1.6k, down 5.1k.
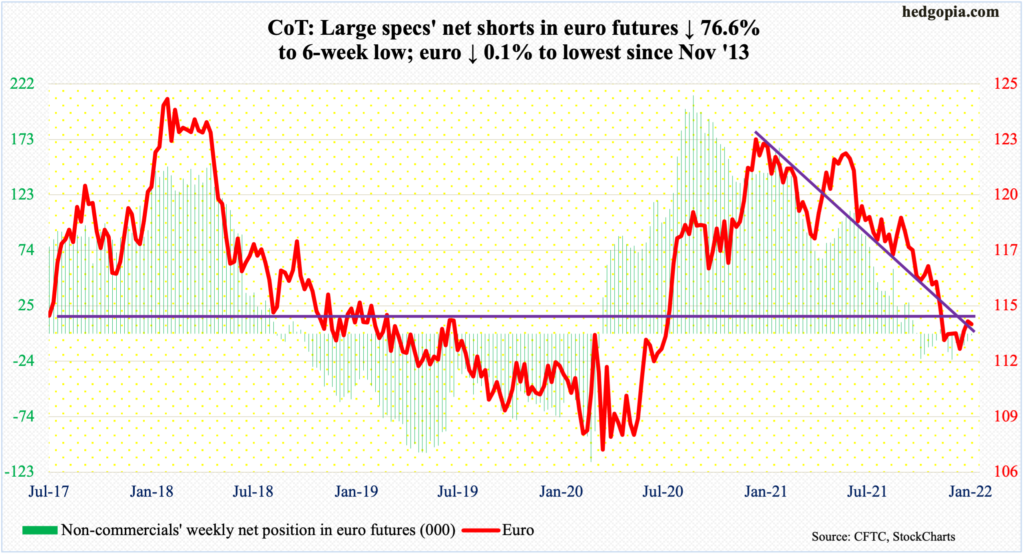
Resistance at $1.14-$1.15, which goes back at least 18 years, is proving tough to crack. On December 31, the euro ticked $1.1377 before minor selling occurred in the subsequent sessions. The downward-sloping 50-day at $1.1367 lies around there as well.
Earlier, the currency ($1.1360) dropped from $1.2345 last January to $1.1186 on November 24. Encouragingly for euro bulls, a rising trend line from that low was bought this Tuesday, resulting in a dragonfly doji week. A takeout of the 50-day – likely in the sessions ahead – can lead to momentum.
In the meantime, non-commercials look ready to flip to net long.
Gold: Currently net long 211.4k, down 1.8k.
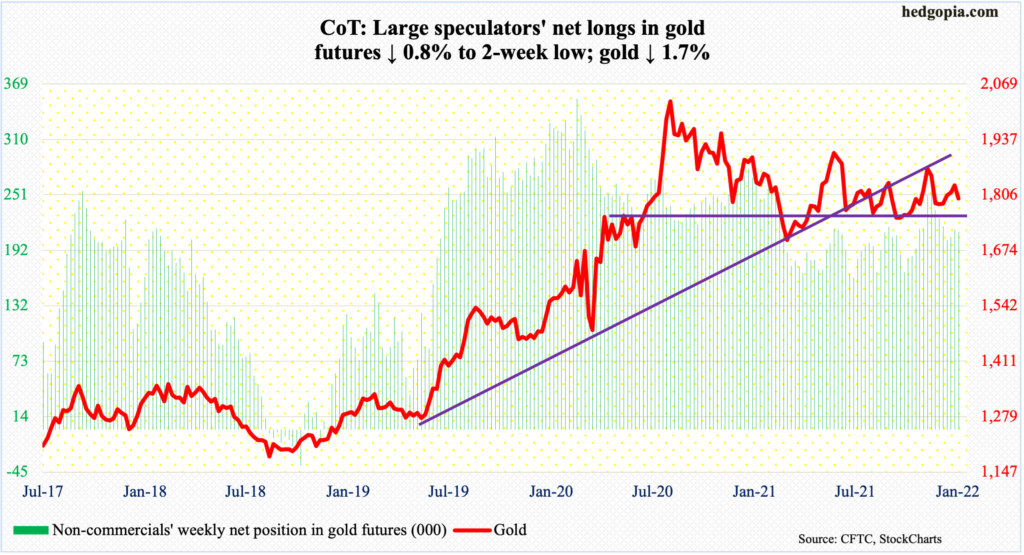
Gold bugs failed to take out $1,830s, with the metal having ticked $1,833 intraday Monday but only to end the session lower 1.6 percent. Horizontal resistance at $1,830s goes back more than a year.
As things stand, the daily seems to want to go lower. Gold ($1,797/ounce) has crucial support at $1,760s-$1,770s.
Nasdaq 100 index (mini): Currently net long 21.7k, up 7.6k.
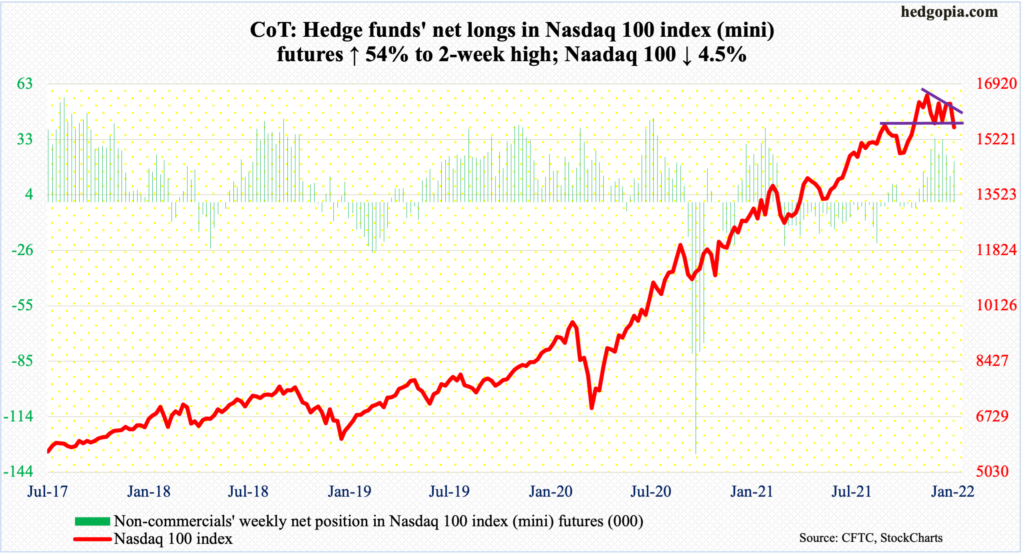
During the post-December 20 rally, the Nasdaq 100 (15592) never surpassed the all-time high from November 22 – 16765 back then versus 16607 on December 28. A lower low was established.
This Wednesday’s 3.3-percent tumble pierced through the 50-day from above. The consolation for tech bulls is that straight-line support at 15700s drew some interest from longs. The level, which was defended on Thursday, was tested again on Friday and was breached slightly. This has raised the possibility of a test of the 200-day (14912) in due course.
Russell 2000 mini-index: Currently net short 15.8k, down 4.5k.
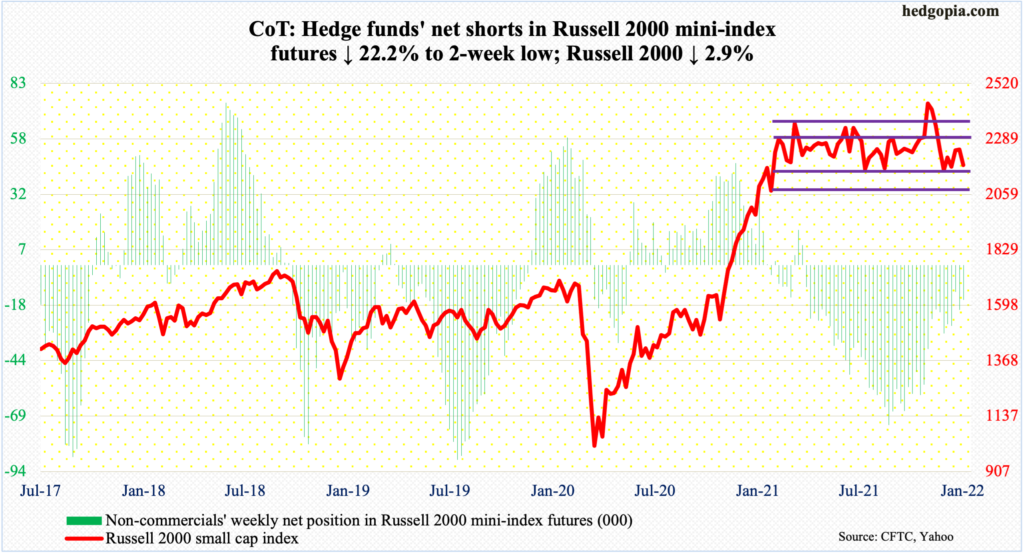
Box resistance at 2280s was tested several times in the last couple of weeks, albeit unsuccessfully. On Tuesday, the Russell 2000 rallied as high as 2288, but only to then close out the week at 2180.
Since March last year, the small cap index has been rangebound between 2350s and 2080s, and between 2280s and 2150s within this rectangle. On Nov 3, it broke out but was quickly followed by a failed retest on the 19th.
This time around, the 50-day (2278) approximates 2280s resistance. The 200-day is at 2255.
As things stand, risk-reward odds favor a drop toward the lower range than a rally toward the upper range.
US Dollar Index: Currently net long 39.1k, up 2.3k.
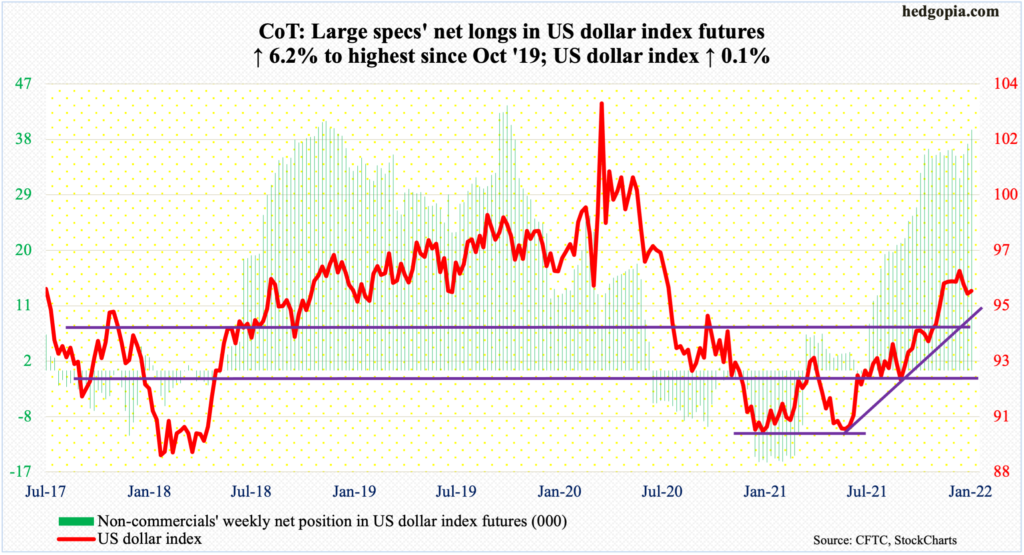
The US dollar index edged up 0.1 percent this week to 95.72. Tuesday’s high of 96.47 was rejected right at a declining trend line from November 24 when it peaked at 96.94. Horizontal resistance around 97 goes back at least 18 years.
The trend line mentioned above is part of a descending triangle, the lower support of which lies at 95.80s. Frequently, such a pattern leads to a breakdown. If such a scenario were to develop, then decent support lies at 94.50s, which is a combination of a multi-year straight line and a rising trend line from May.
Non-commercials are heavily net long. It can take a while once they begin to unwind their holdings.
VIX: Currently net short 60.5k, up 13.3k.
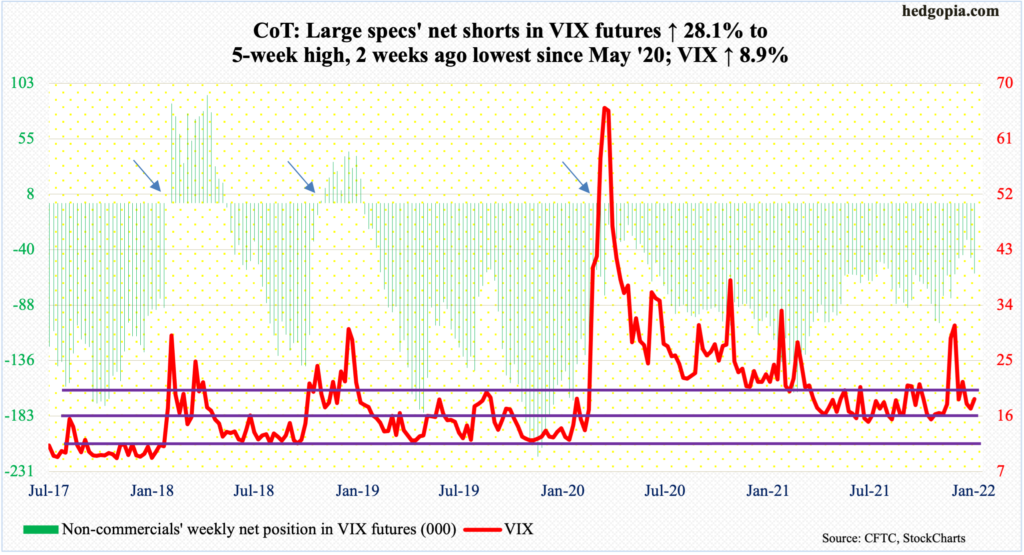
A rising trend-line from November 2017 when VIX reached an all-time low of 8.56 was never tested this week. It would have occurred around 15 but the volatility index put in a low of 16.34 on Tuesday.
Encouraging for volatility bulls, the daily MACD is on the verge of a potentially bullish crossover. VIX closed Friday at 18.76.


Comments
Log in or sign up to join the conversation.