
Value Investing: What History Says About Five-Year Periods After Valuation Peaks
No matter how you slice it, Value stocks are historically cheap compared to the past.

There have been numerous articles on this topic, such as Ryan’s post here, Larry Swedroe’s post here, and more recently, Cliff Asness’ post here.
Cliff’s post is one picture, shown below. 1
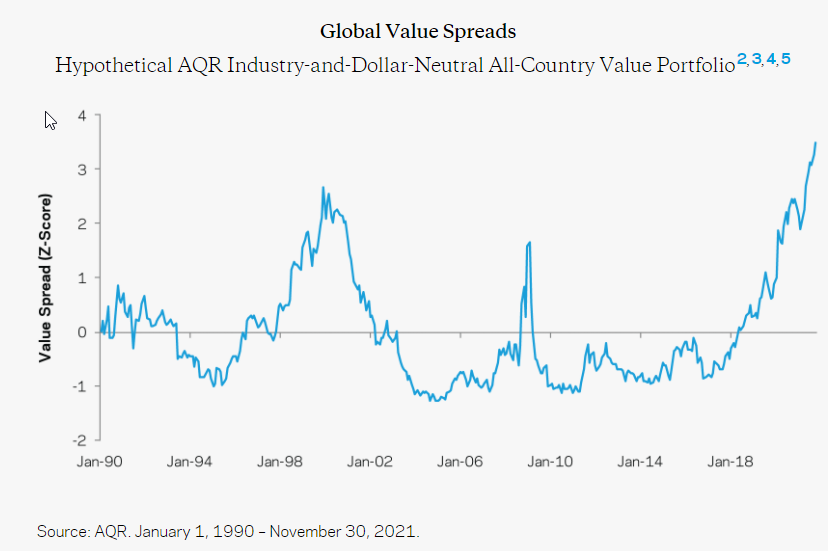
Source: https://www.aqr.com/Insights/Perspectives/Thats-it-Thats-the-Blog
The image above shows the relative “cheapness” of Value using a value composite measure across multiple countries. 2
What one notices is that there are three peaks around the following dates:
- Internet Bubble–12/31/1999.
- Global Financial Crisis–12/31/2008.
- Today–near the end of December 2021.
On our website, we also have a tool, our Visual Value Factors module, that allows individuals to see how cheap/expensive Value portfolios are on a variety of measures. 3
So what does our tool say?
Similar results to AQR:
The U.S. EBIT/TEV since 1992 (light blue line):

Source: Alpha Architect
The Developed International Value EBIT/TEV since 1992 (black line):
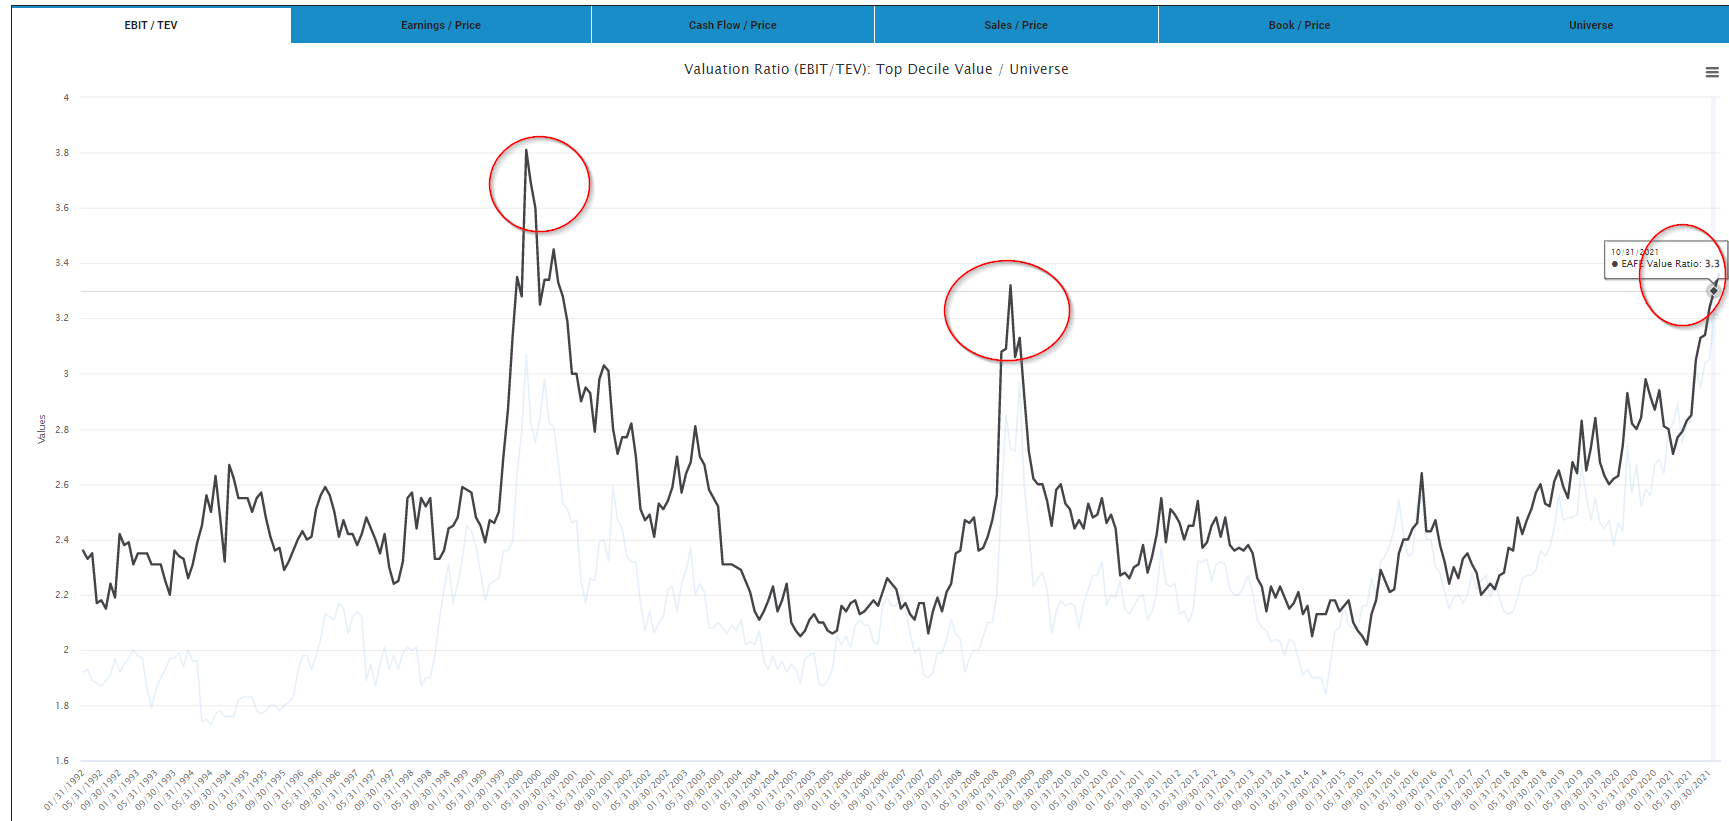
Source: Alpha Architect
In summary, in both the U.S. market, as well as Developed International markets 4, Value is cheap relative to the past, with the same three peaks as AQR.
We find similar results using B/M and E/P measures.
Given this fact, a natural question I was asked last week during a meeting was the following, “After the last two times Value had a “peak” of the factor being cheap, how did value investing do the subsequent five years?”
A good question.
To answer that, we can examine how the top decile of Value stocks did in both the U.S. and international markets the five-year stretch after 12/31/1999 and 12/31/2008.
Value Investing from 1/1/2000-12/31/2004
We examine two Value portfolios in the U.S. markets:
- The top decile on EBIT/TEV from our Factor Database.
- The top decile on E/P from our Factor Database.
The starting universe in either the U.S. or international markets is the 1,500 largest stocks in each market. So the top decile is a portfolio of ~ 150 mid/large-cap stocks. For the main results, the portfolios are equal-weighted. 5
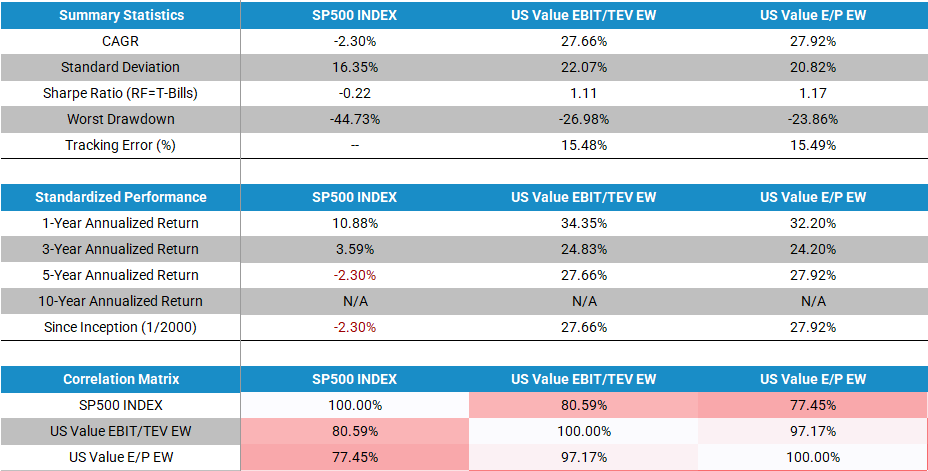
Below are the returns against the S&P 500 index. All returns are gross of any fees or transaction costs. Our value portfolios here are equal-weighted.
1/1/2000-12/31/2004 U.S. market:
The results are hypothetical results and are NOT an indicator of future results and do NOT represent returns that any investor actually attained. Indexes are unmanaged and do not reflect management or trading fees, and one cannot invest directly in an index. Please see a list of descriptions and a list of disclosures here.
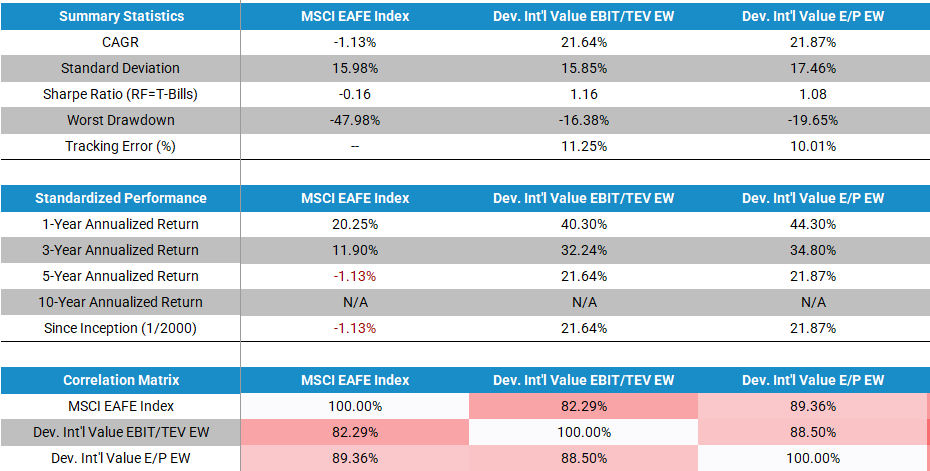
What about International markets?
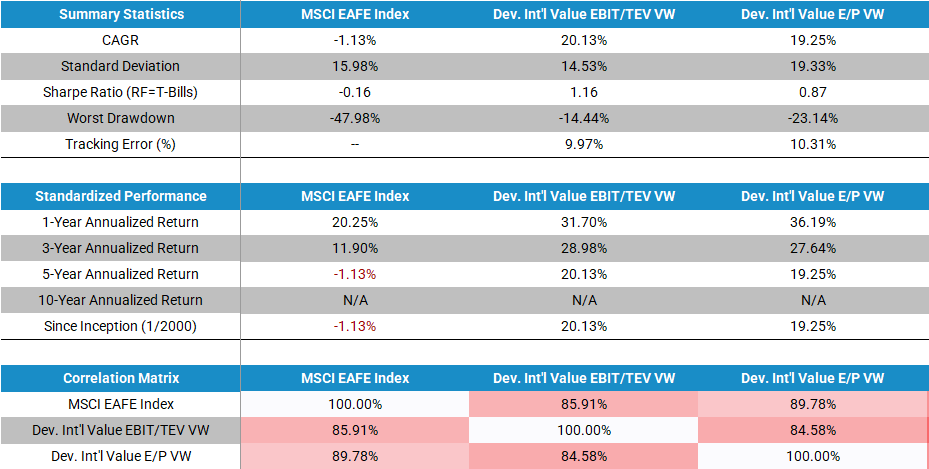
Below we perform the same exercise against the MSCI EAFE index. All returns are gross of any fees or transaction costs. Our value portfolios here are equal-weighted.
1/1/2000-12/31/2004 developed international markets:
The results are hypothetical results and are NOT an indicator of future results and do NOT represent returns that any investor actually attained. Indexes are unmanaged and do not reflect management or trading fees, and one cannot invest directly in an index. Please see a list of descriptions and a list of disclosures here.
In both the U.S. and developed international markets, the five-year stretch after the Internet bubble was a boon for Value investors. The U.S. outperformance was around 30% annualized for 5 years! In international markets, the outperformance was around 23% annualized over 5 years! 6
So let’s move onto the next valuation peak–12/31/2008.
Value Investing from 1/1/2009-12/31/2013
We perform the same analysis over a new five-year stretch.
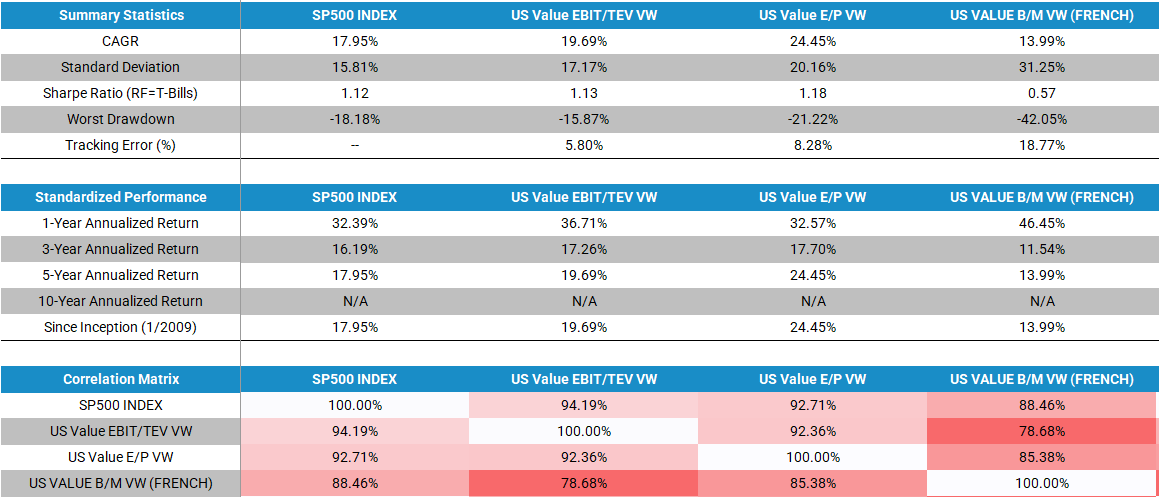
1/1/2009-12/31/2013 U.S. market:
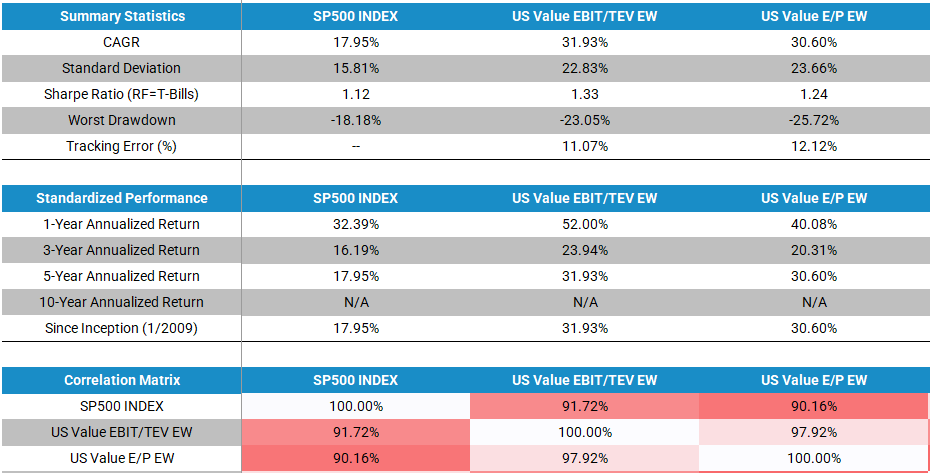
The results are hypothetical results and are NOT an indicator of future results and do NOT represent returns that any investor actually attained. Indexes are unmanaged and do not reflect management or trading fees, and one cannot invest directly in an index. Please see a list of descriptions and a list of disclosures here.
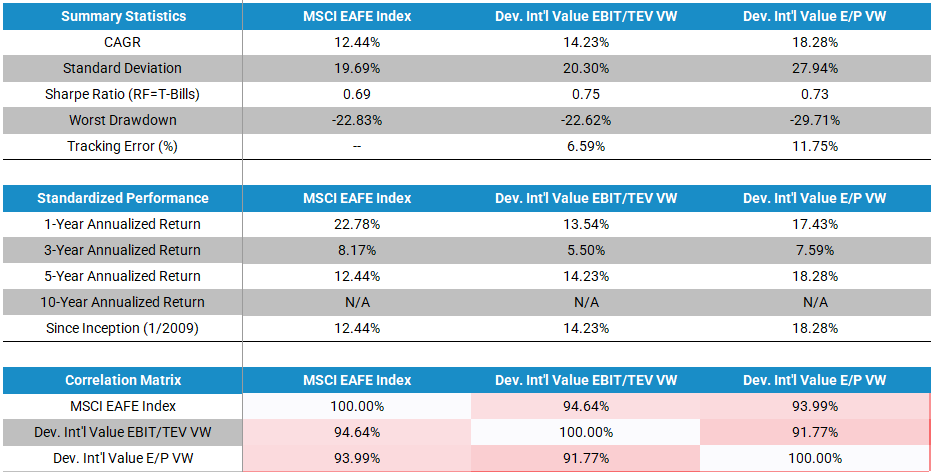
1/1/2009-12/31/2013 developed international markets:
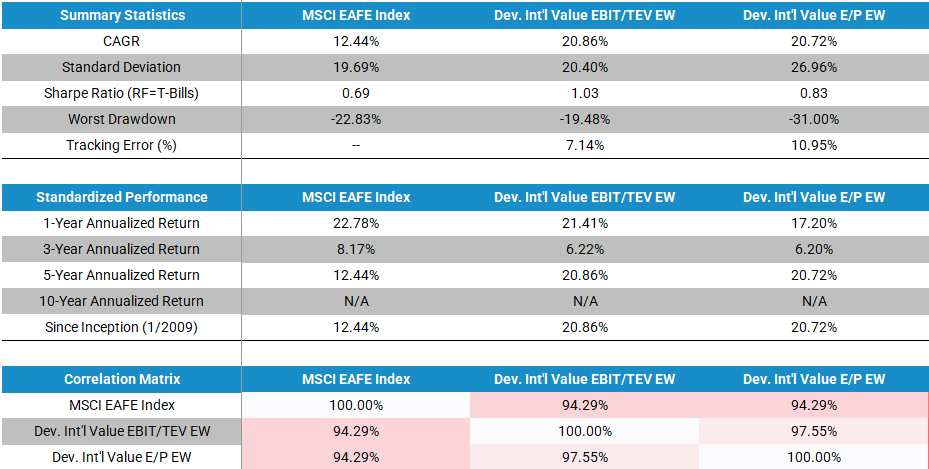
The results are hypothetical results and are NOT an indicator of future results and do NOT represent returns that any investor actually attained. Indexes are unmanaged and do not reflect management or trading fees, and one cannot invest directly in an index. Please see a list of descriptions and a list of disclosures here.
Overall, the conclusions are the same–the five-year stretch after the valuation peak was another good time to be a value investor. Not nearly as good as after the 1999 peak, but the relative outperformance was around 13% annualized in the U.S. and 8% annualized in international markets! 7
Conclusions
As shown above, in the past two instances of a valuation peak in Value portfolios, the next five-year stretch was a good time to be a value investor. However, as we all know, history is not a perfect indicator of the future and it is difficult to time the valuation “peak” and it can go on for years at a time. For example, Value has been relatively cheap the last 2+ years, only to lose to the market and growth investing.
With the caveats that no one can predict the future, this article outlines how Value Investing did after the prior two valuation peaks.
Notes:
- And five footnotes.
- Full details in the source document.
- Unlike AQR, we (1) separate the U.S. and Developed International markets (they also include Emerging markets), (2) do not use composites, but examine each measure independently, and (3) do not use Z-scores.
We simply do the following–for each valuation measure, divide the Value decile’s valuation metric (such as EBIT/TEV) against the valuation metric for the market. This creates a ratio, over time, of the Value portfolio over the market portfolio. 8There are valid arguments to use Z-score, industry adjustments, etc. Our tool is one of many online resources investors should use.
- EFA ETF markets
- Below is where one can find this data on our website:
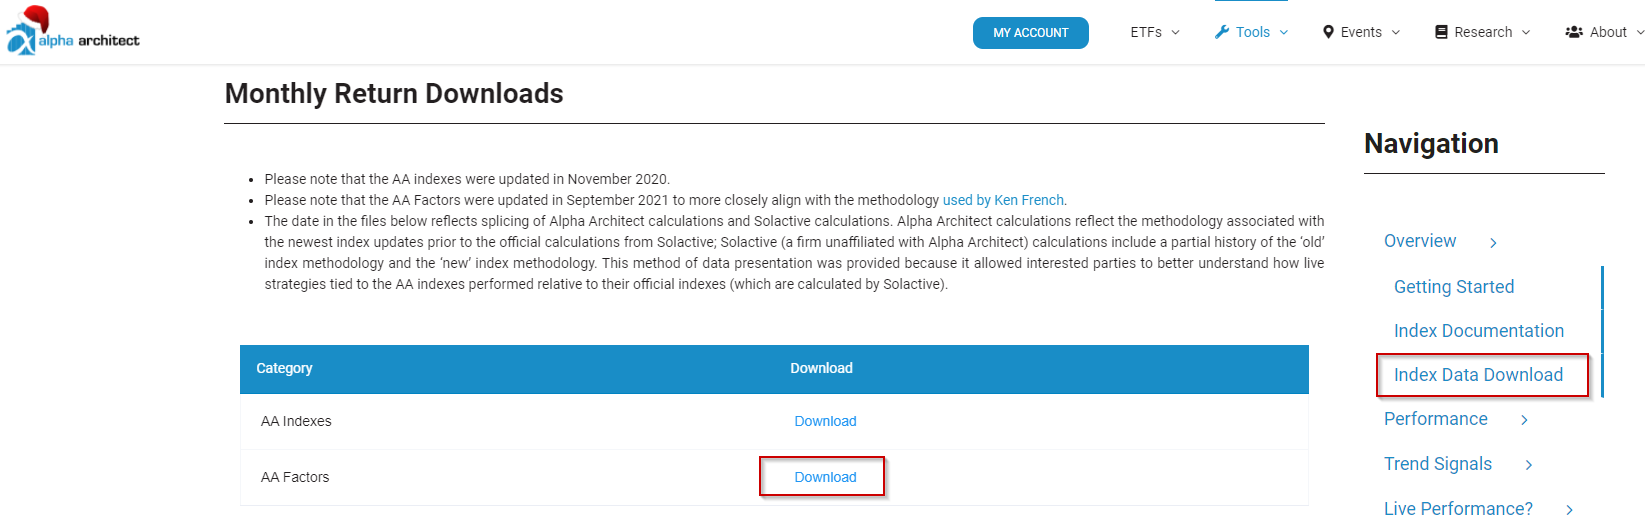
Source: Alpha Architect
- Results were slightly lower using market-cap weighted portfolios, as evidenced below, including Ken French’s top decile on B/M. All Value portfolios below are market-cap weighted and are gross of any fees or transaction costs.
1/1/2000-12/31/2004 U.S. market:
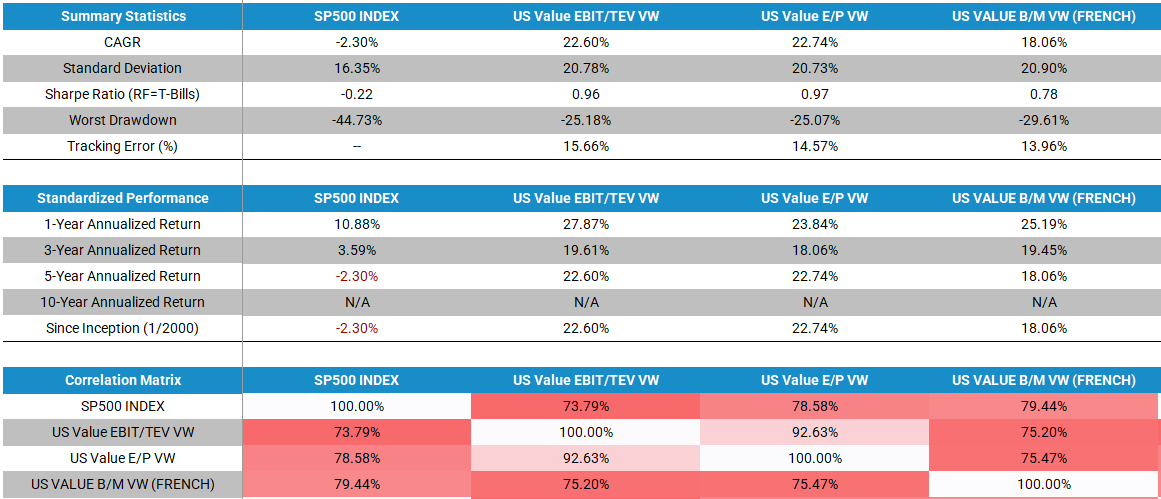
The results are hypothetical results and are NOT an indicator of future results and do NOT represent returns that any investor actually attained. Indexes are unmanaged and do not reflect management or trading fees, and one cannot invest directly in an index. Please see a list of descriptions and a list of disclosures here.
1/1/2000-12/31/2004 developed international markets:
The results are hypothetical results and are NOT an indicator of future results and do NOT represent returns that any investor actually attained. Indexes are unmanaged and do not reflect management or trading fees, and one cannot invest directly in an index. Please see a list of descriptions and a list of disclosures here.
- Results were slightly lower using market-cap weighted portfolios, as evidenced below, including Ken French’s top decile on B/M. All Value portfolios below are market-cap weighted and are gross of any fees or transaction costs.
1/1/2009-12/31/2013 U.S. market:
The results are hypothetical results and are NOT an indicator of future results and do NOT represent returns that any investor actually attained. Indexes are unmanaged and do not reflect management or trading fees, and one cannot invest directly in an index. Please see a list of descriptions and a list of disclosures here.
1/1/2009-12/31/2013 developed international markets:
The results are hypothetical results and are NOT an indicator of future results and do NOT represent returns that any investor actually attained. Indexes are unmanaged and do not reflect management or trading fees, and one cannot invest directly in an index. Please see a list of descriptions and a list of disclosures here.
Disclaimer: Performance figures contained herein are hypothetical, unaudited and prepared by Alpha Architect, LLC; hypothetical results are intended for illustrative purposes only. Past ...
more

