U.S. Trade With World Shrinks Again
The value of goods imported and exported by the United States to the world continued to shrink in July 2023. The trailing twelve-month average of the combined total of U.S. imports and exports, continues a trend that began after this measure of trade peaked in February 2023.
Digging into the trailing year average trend, we find that both imports and exports have fallen. For trade with all nations, U.S. imports have fallen by 2.4 times as much as U.S. exports have. Excluding trade with China, the decline in imports between the U.S. and the rest of the world outpaces the decline in exports by a factor of 1.3.
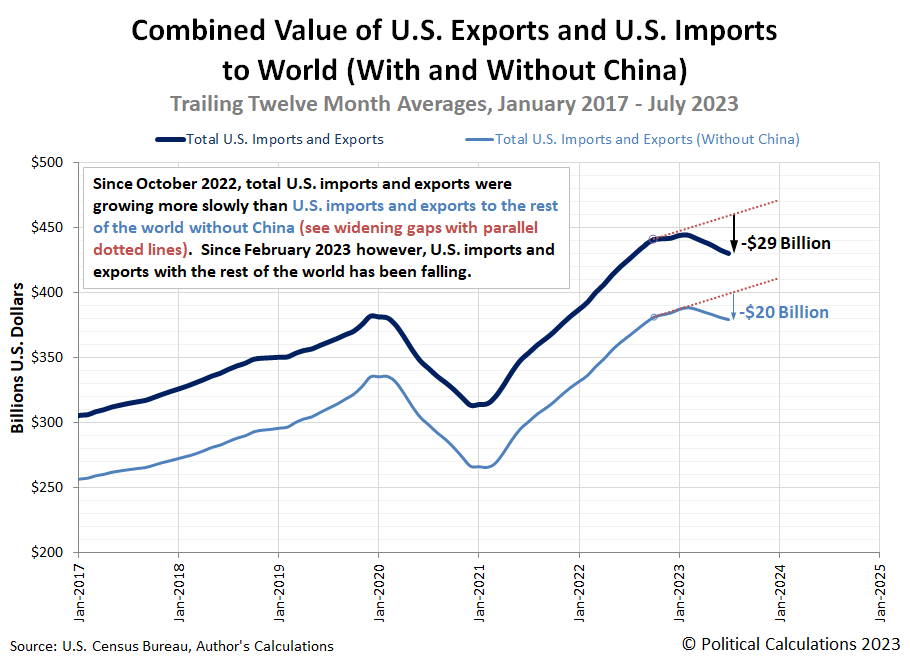
We've put numbers to the decline in the following chart for these trailing twelve-month averages, which tracks both the combined value of goods traded between the U.S. and the rest of the world, both with and without the contribution of trade with China. The indicated declines are with respect to a counterfactual, which assumes the value of U.S. trade would have grown at the rate it did between it and the rest of the world excluding China from October 2022 through February 2022.
The overall value of goods traded between the U.S. and the entire world has fallen by about $29 billion since February 2023. Excluding China's contribution to that trade has seen the value of goods imported and exported to and from the U.S. fall by about $20 billion.
Meanwhile, the U.S.' trade with China has been in active decline since October 2022. Here we're measuring how trade has changed using a different counterfactual based on the recovery of trade between the U.S. and China following the 2008-09 recession. We find the gap between that positive trade growth trajectory and the actual trajectory trade between the countries has taken increased to $11.3 billion, as indicated in the next chart.
Prior to November 2022, the actual trajectory of trade between the U.S. and China and the counterfactual had only differed by comparatively small margins. Starting in November 2022 however, the combined value of goods traded between the two nations has fallen substantially. In July 2023, it remains much lower than it was a year earlier, even though that value ticked up from the previous month.
The magnitude of the current decline is similar to that recorded during the 2018-19 tariff war between the two nations.
Looking forward, early trade data from China for August 2023 indicates the negative trend will continue:
China’s exports to the U.S. in dollar terms fell by 9.5% in August from a year ago, better than a drop of more than 20% in each of the prior two months, according to CNBC calculations of official data accessed through Wind Information.
China’s imports from the U.S. fell by 7.9% in August from a year ago, an improvement from a double-digit decline in July, the data showed.
Which is to say more year-over-year declines are to be expected, though smaller than they were in either June or July 2023. We'll find out what the U.S. side of the trade ledger says next month.
References
U.S. Census Bureau. Trade in Goods with China. Last updated: 8 August 2023.
U.S. Census Bureau. Trade in Goods with World, Not Seasonally Adjusted. Last updated: 8 August 2023.
More By This Author:
The S&P 500 Loses Its Silvery LusterNew Homes Becoming Even More Unaffordable With Rising Mortgage Rates
Dividends By The Numbers In August 2023
Disclosure: Materials that are published by Political Calculations can provide visitors with free information and insights regarding the incentives created by the laws and policies described. ...
more


