
The level of U.S. Treasury yields and the changing shape of the Treasury yield curve provide investors with critical feedback regarding the market’s expectations for economic growth, inflation, and monetary policy. Short- and long-term yields have recently fallen, with short-term maturities leading the charge.

The changes result in what bond traders call a bull steepening yield curve shift. The shift is due to weakening economic conditions, moderating inflation, and the increasing likelihood that the Fed will lower rates.
Yield curves are essential indicators that bond investors closely follow. However, many stock investors do not track yield curves despite the importance of bond yields on stock returns. Therefore, in this two-part series, we start with an introductory discussion of the four primary types of yield curve shifts and what they often entail from an economic and inflation perspective.
In Part Two, we provide a quantitative perspective on what a continued bull steepening trade may mean for returns of the major stock indices, along with various sectors and factors.
Treasury Yield Curve History
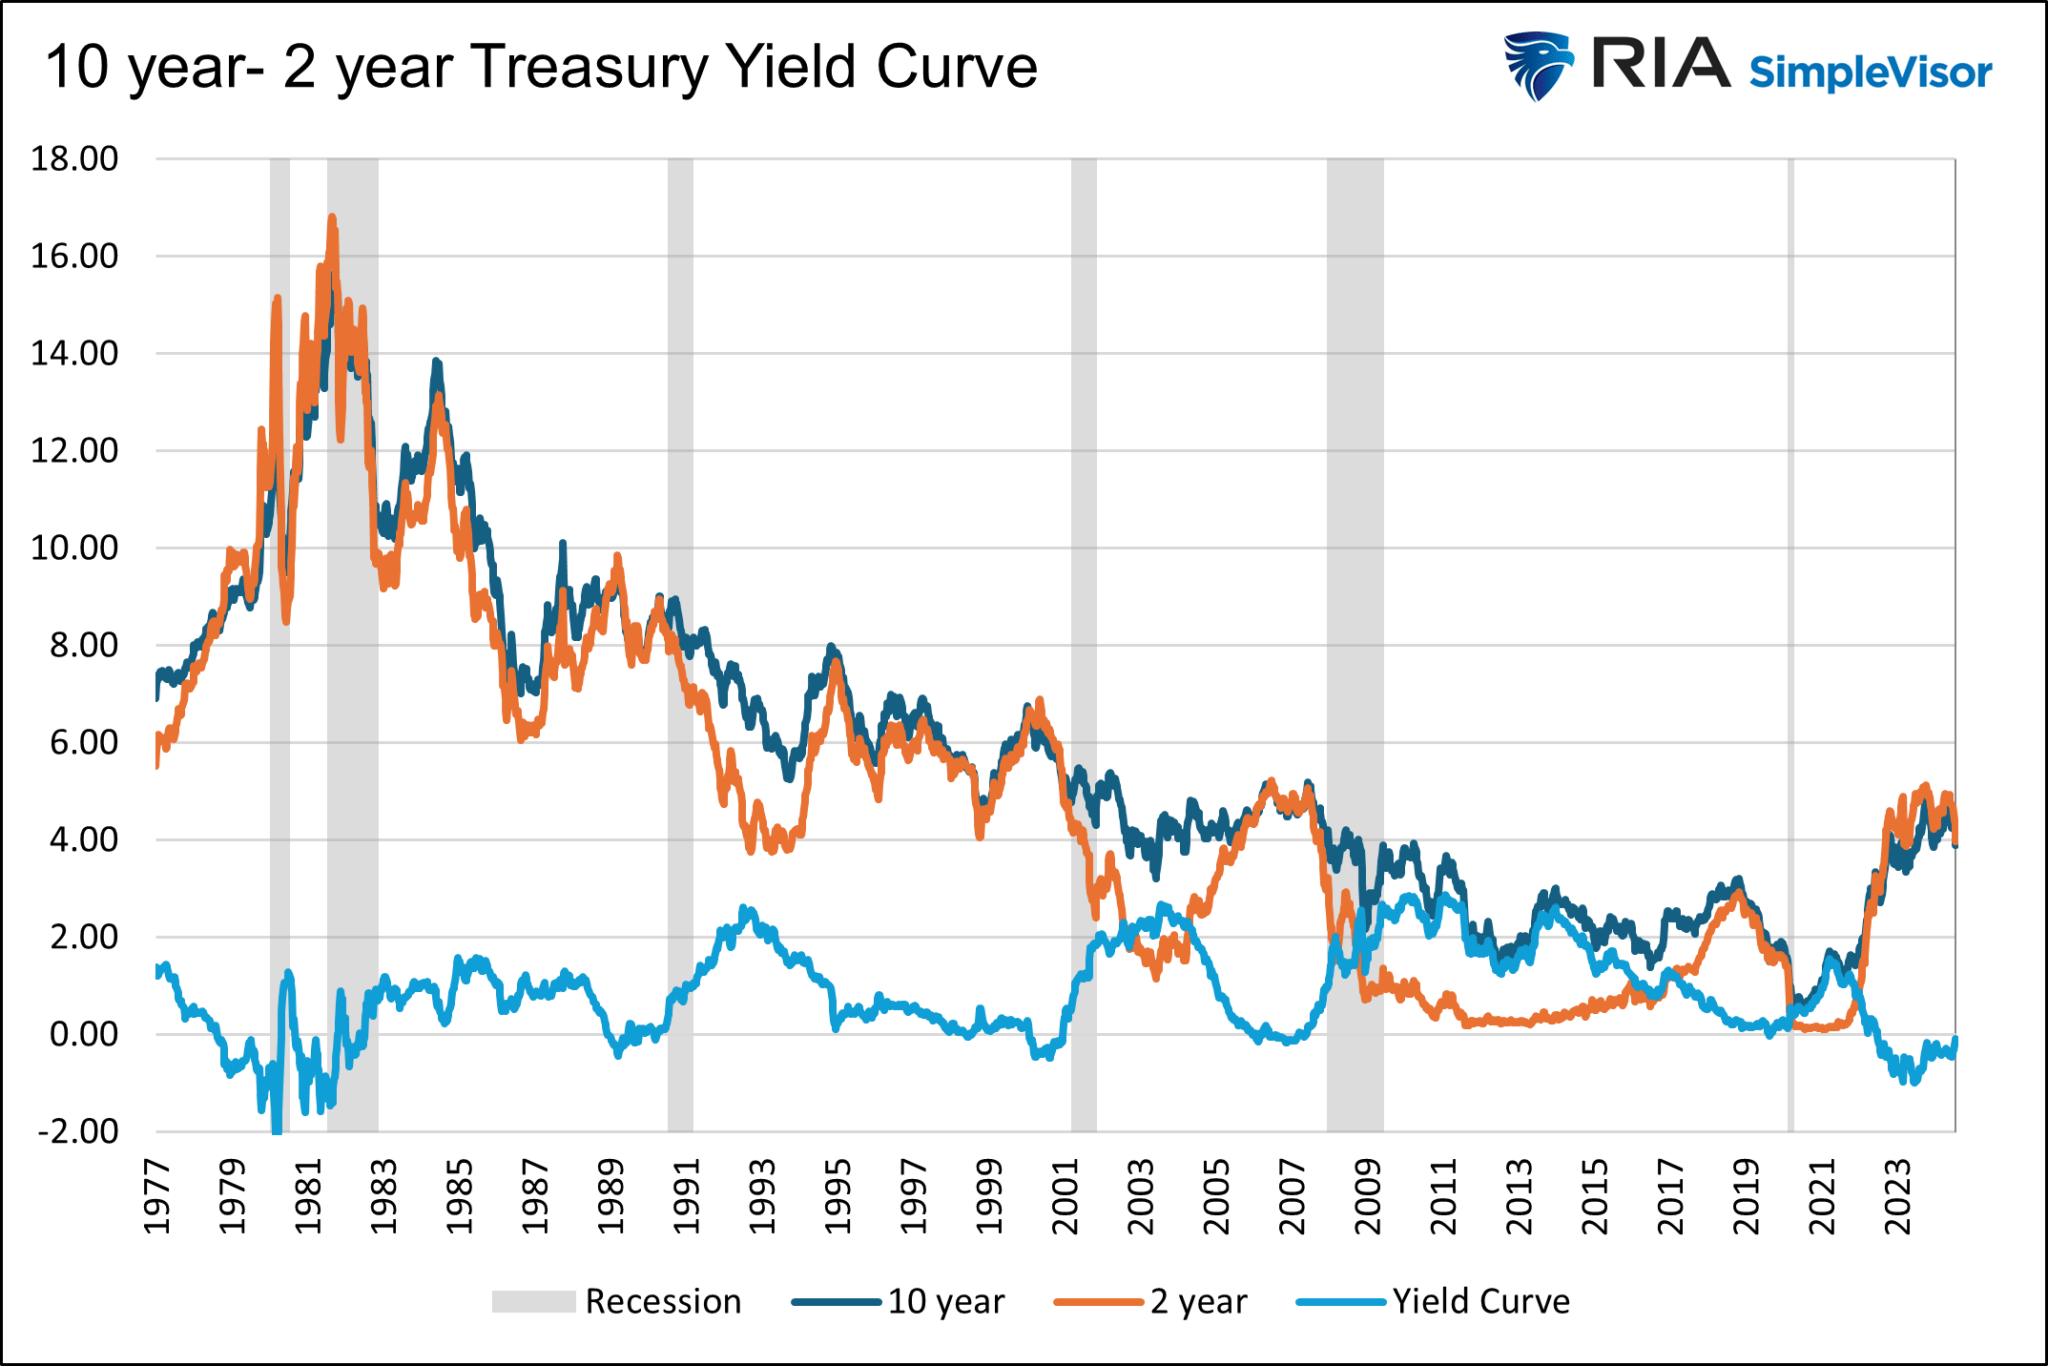
The graph below charts ten- and two-year Treasury yields and the difference between the two securities. The difference is called the 10-year/2-year yield curve. As you may have noticed, the yield curve has a recurring pattern that is well correlated with the economic cycle.
Generally, the yield curve steepens (the difference between the 10-year and 2-year yields increase) rapidly following a recession. Then, throughout most typical economic expansions, the curve flattens (the difference declines). The yield curve often inverts (the ten-year yield is less than the two-year yield) toward the end of the expansion.
One of the most accurate recession indicators occurs when an inverted yield curve steepens, returning it to positive territory. Lastly, the yield curve rises rapidly as the Fed lowers rates to boost economic activity and fight off a recession. Rinse, wash, repeat.
The Baby Bull Steepening
The recent spate of weakening labor data and broader economic activity, alongside moderating inflation, has the markets convinced the Fed will embark on a series of rate cuts starting in September. Furthermore, Jerome Powell has all but given them the green light. Per his Jackson Hole speech:
The time has come for policy to adjust. The direction of travel is clear, and the timing and pace of rate cuts will depend on incoming data, the evolving outlook, and the balance of risks.
Bond yields have been falling, with the shorter-term bond yields falling the most. It’s hard to see on the graph above, but the recent bond market rally has caused the yield curve (light blue) to increase from negative 46 basis points in mid-June to negative single digits today. It is now on the verge of uninverting and consequently close to sending a recession warning.
This type of move in long and short-term bond yields is commonly referred to as a bullish steepening. The words bull or bullish relate to the fact that bond yields are falling, and subsequently, bond prices are rising. Steepening refers to the shape of the yield curve, which has increased, albeit the current yield curve is still negative.
In Part Two of this article, we will evaluate prior bull steepening cycles and quantify what it has meant for stock returns. But, to better acquaint you with yield curves, it’s worth discussing the four principal types of yield curve shifts and what they often portend.
Bull Steepening
As the name bear steepening suggests, yields for short and long-term maturities increase, with longer-term yields rising more than shorter-term yields. In the graph below, the two-year yield increases from 3.35% to 4.10%, and the ten-year yield rises from 3.80% to 5.10%. The result is an upward shift in the yield curve from .45% to 1.00%
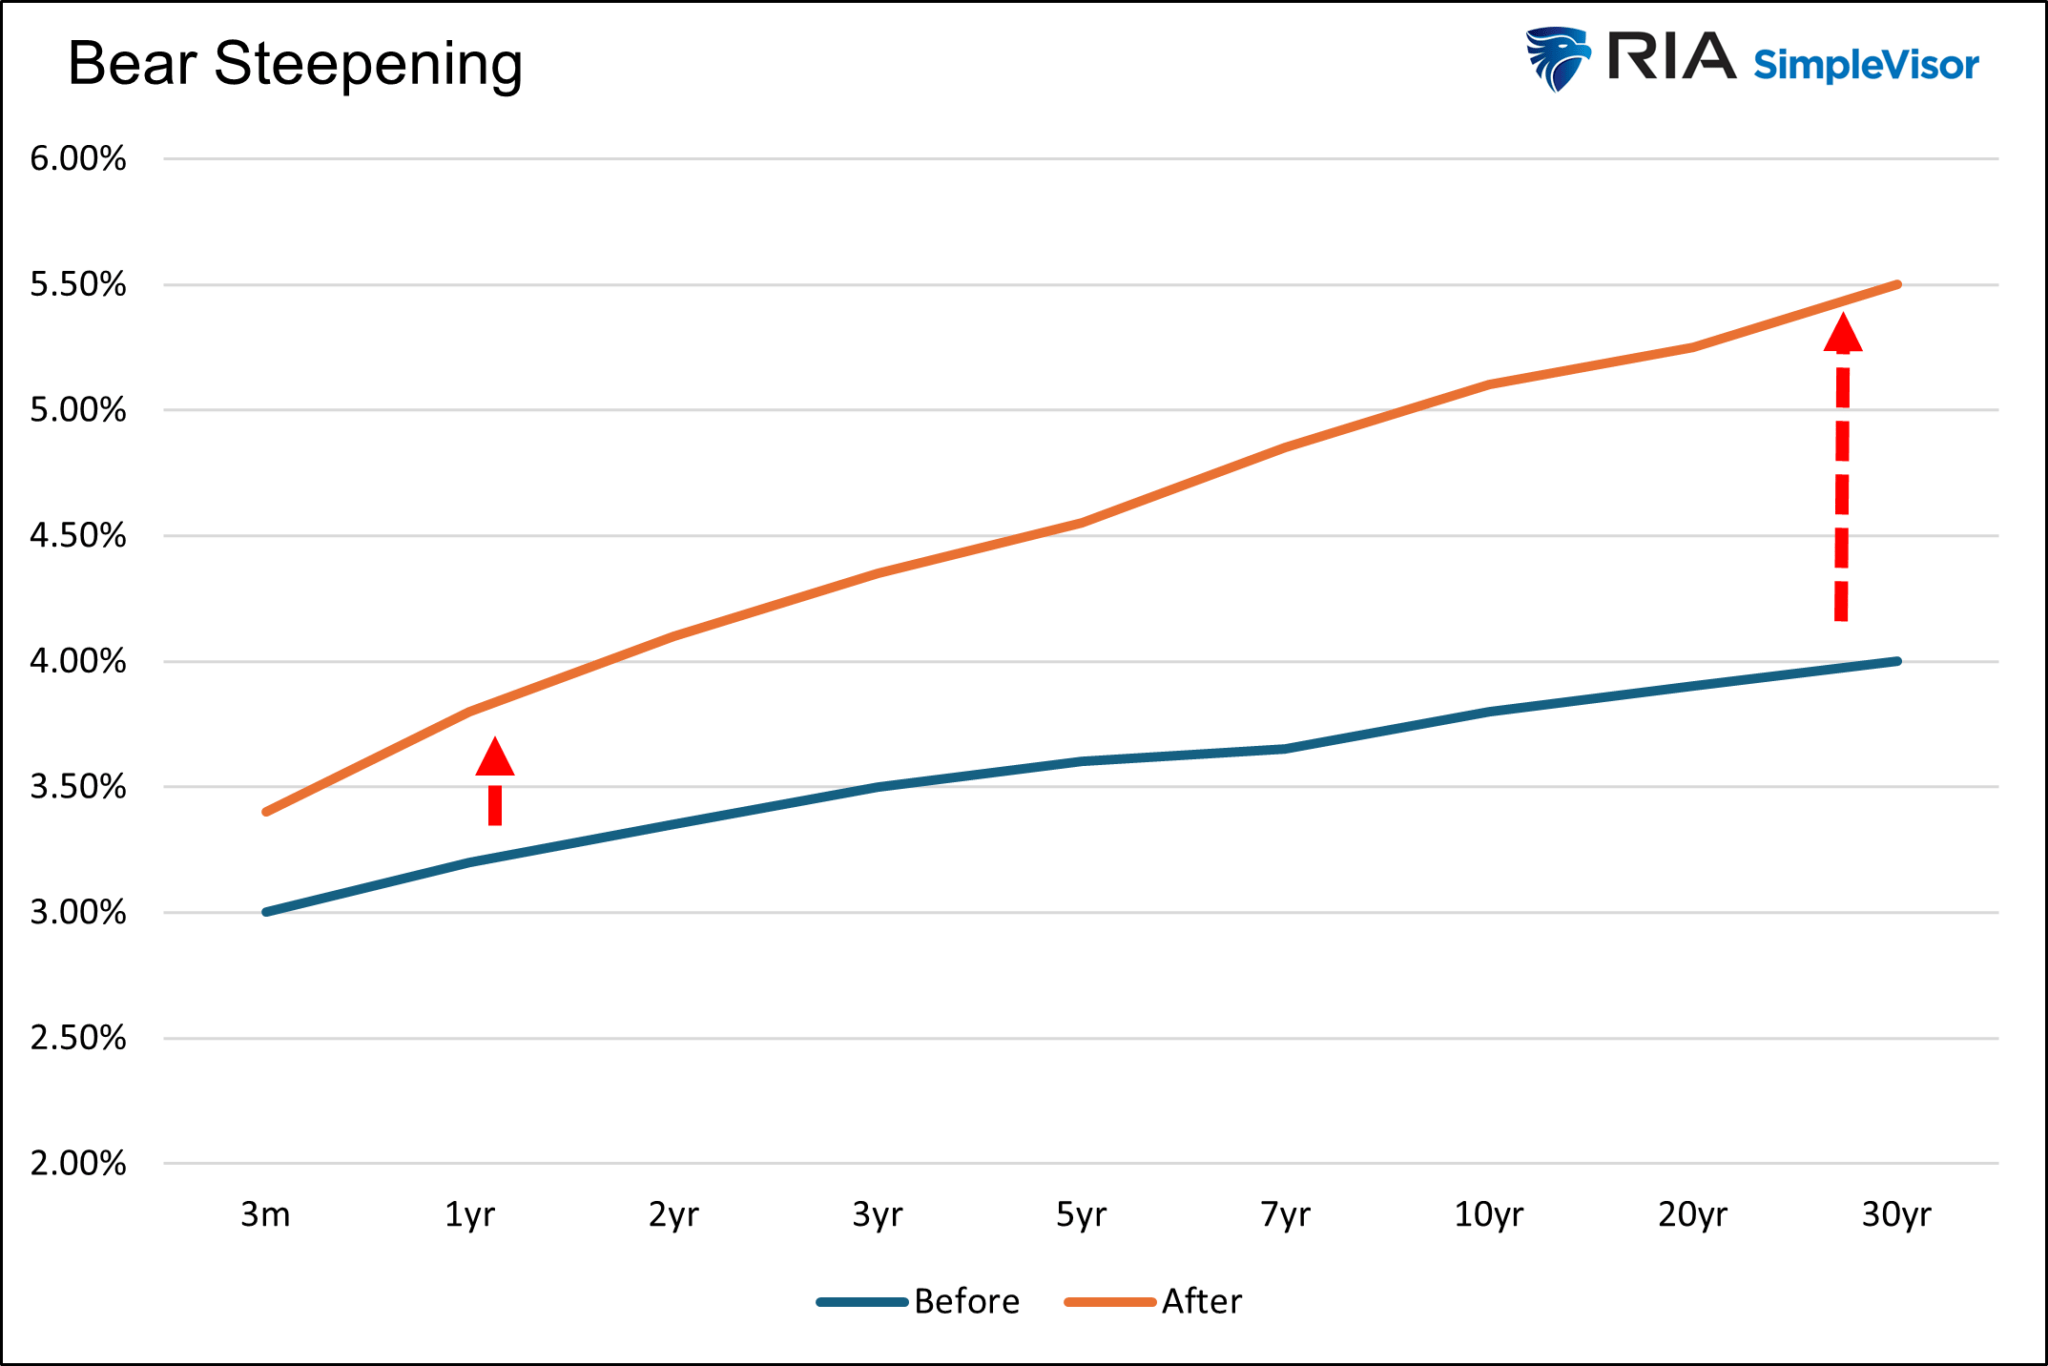
In 2020 and 2021, the yield curve shifted this way. At the time, the Fed lowered rates to zero and did massive amounts of QE. Bond yields started to rise in anticipation of a rebound in economic activity and growing inflation concerns due to massive fiscal and monetary stimulus. Short-term yields didn’t move nearly as much as long-term yields. This occurred because the Fed pledged to keep Fed Funds very low to combat the pandemic.
In late 2023, the bear steepening reoccurred as the economy continued to run above its natural rate despite 5% Fed Funds. Higher interest rates were not impacting the economy meaningfully, and inflation stopped falling. The market thought the Fed may need to raise rates more. However, demand for money market investments was insatiable due to significant cash and money market balances, which helped keep a lid on short-term rates. At the long end of the curve, investors were forced to absorb substantial Treasury debt issuance. Accordingly, they demanded extra yield. This is referred to as an increasing term premium.
Bull Flattener
A bull flattener trade involves short and long-term-maturity bond yields declining with longer-end yields falling more. The graph below shows two-year yields declining by 0.70% and ten-year yields declining by 1.00%. The net result is a curve flattening of .30%
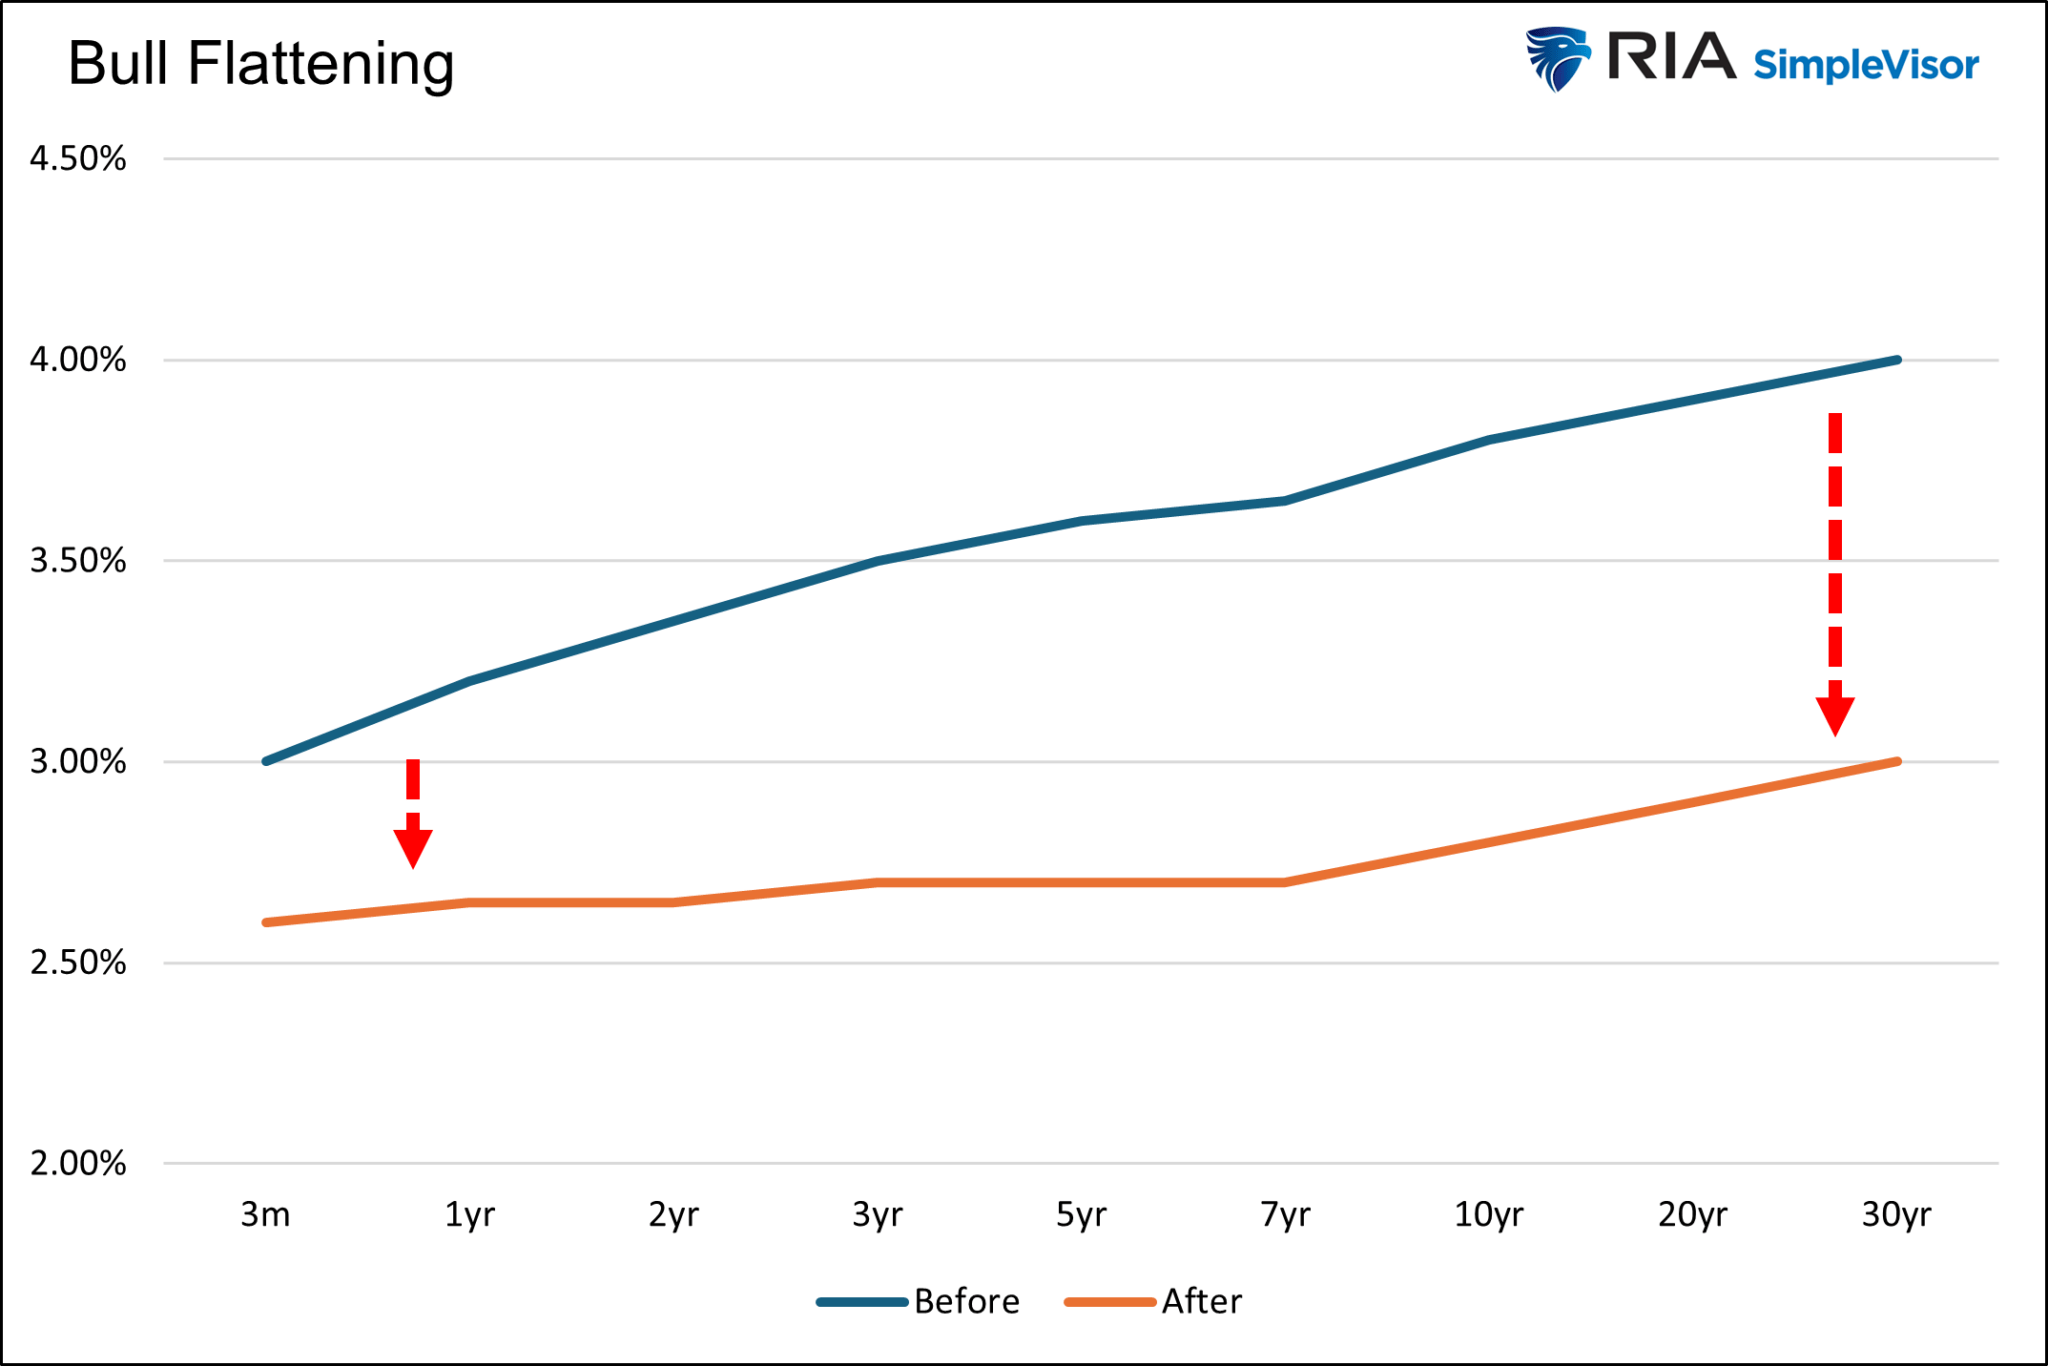
Bull flattening shifts tend to be the result of relative economic optimism. The market is encouraged because inflation is likely to fall, but it is not overly concerned that lower inflation is due to waning demand. Therefore, investors are not expecting much regarding Fed rate cuts.
Conversely, the market may be concerned about the economy, but if Fed Funds are at or near zero, there is no room for the short end of the yield curve to fall. 2016 is a good example. Fed Funds were already at zero, and the economy was weakening, with inflation remaining below the Fed’s target. Longer-term bonds moved lower with inflation and economic prospects, but short-term bonds were stuck with the Fed not wanting to lower rates below zero.
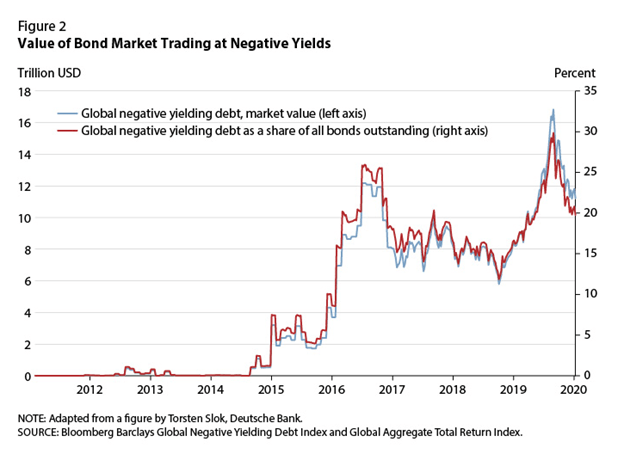
The graph below, courtesy of Deutsche Bank, shows that the dollar value of negative-yielding global bonds rose sharply in 2016. Despite the international trends, U.S. yields largely remained above zero percent.
As we just noted, a bull or bullish steepening occurs when all Treasury yields decline, but shorter maturities fall more than longer maturities. In our hypothetical example below, the two-year note falls from 3.35% to 1.50%, while ten-year notes decline from 3.80% to 2.80%. As a result, the yield curve steepens by .85%
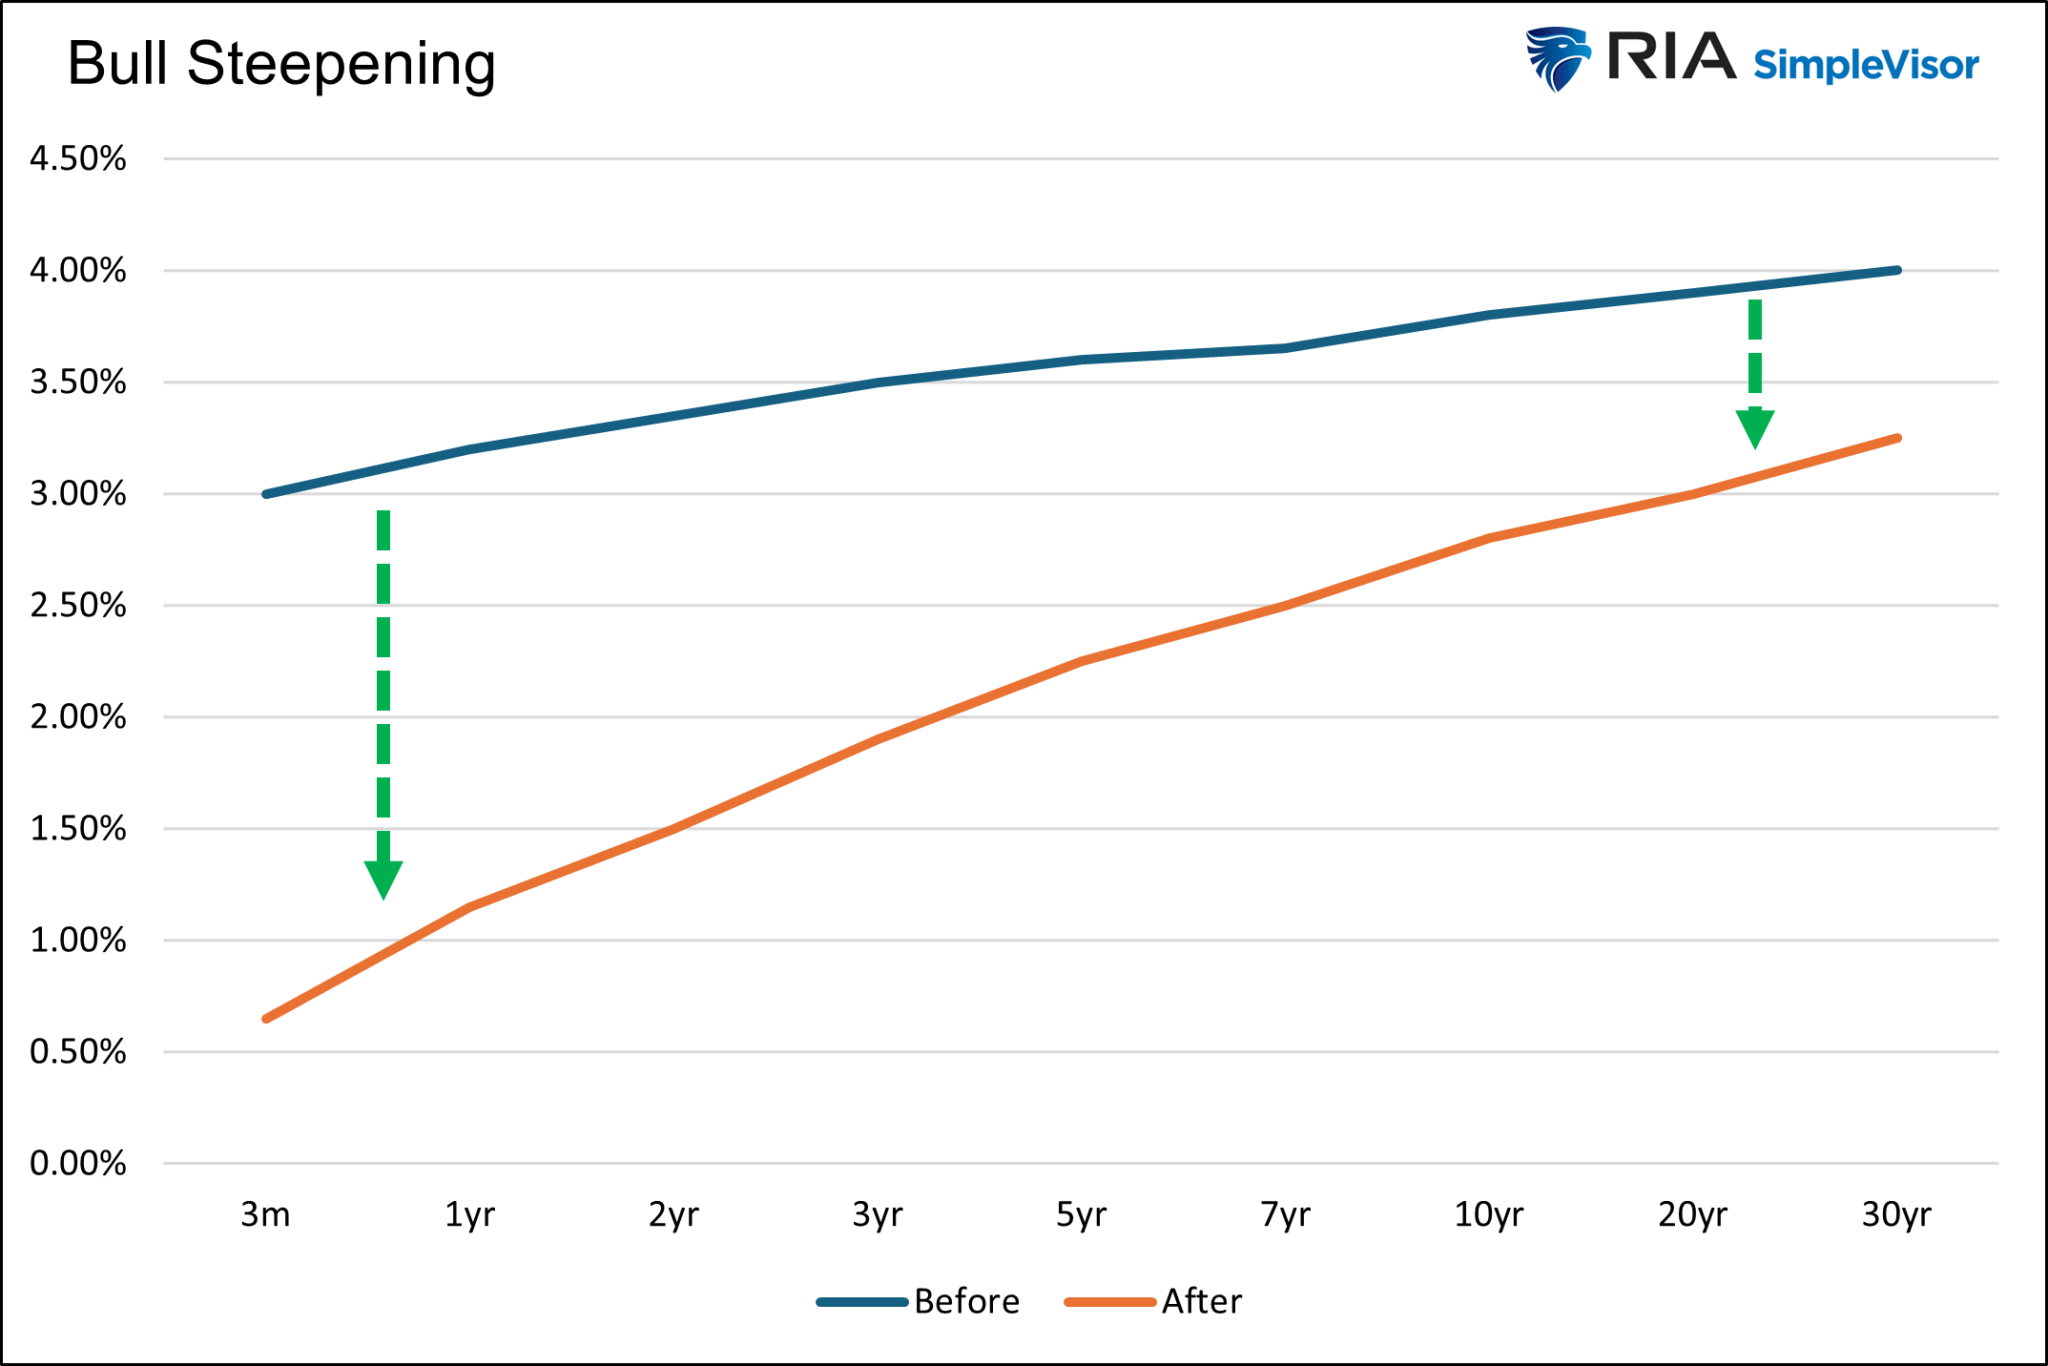
Most often, a bull steepening trade results from traders anticipating easier monetary policy due to pronounced economic weakness and a growing likelihood of recession. Given that shorter-maturity bonds are more correlated to Fed Funds than longer-maturity bonds, it makes sense that they would fall quicker when such expectations arise.
The recent bull steepening has been textbook. The unemployment rate has risen from 3.7% to 4.3% this year, and in general, many economic indicators point to slower growth. Furthermore, inflation appears to be trending lower again, giving the Fed more comfort in lowering rates. Per Powell’s Jackson Hole speech:
My confidence has grown that inflation is on a sustainable path back to 2%.
Bear Flattening
In a bear-flattening trade, yields rise across the curve, with shorter maturities rising the most. The two-year note increases from 3.35% to 4.40% in the graph below. The ten-year note rises from 3.80% to 4.20%. In the process, the curve flattens and inverts from .45% to -.20%.

Summary
With an appreciation for yield curves, it is time to focus on the yield curve shift du jour.
What might a bullish steepening trade mean for various stock indices, sectors, and factors?
Here’s a hint. The stock market seems to love the idea of the Fed lowering rates before they do so. But, when the Fed lowers rates, the result is not often friendly for stock investors.
Read Part 2 >>> Bull Steepening Is Bearish For Stocks – Part Two
More By This Author:
Fed Funds Futures Offer Bond Market Insights
Stealth QE Or Rubbish From Dr. Doom?
Confidence Is The Underappreciated Economic Engine


Comments
Log in or sign up to join the conversation.