
Year-On-Year Vs. Month-On-Month Inflation For Headline, Core
Dramatic plunge in headline CPI m/m inflation, but both headline and core surprise on upside.
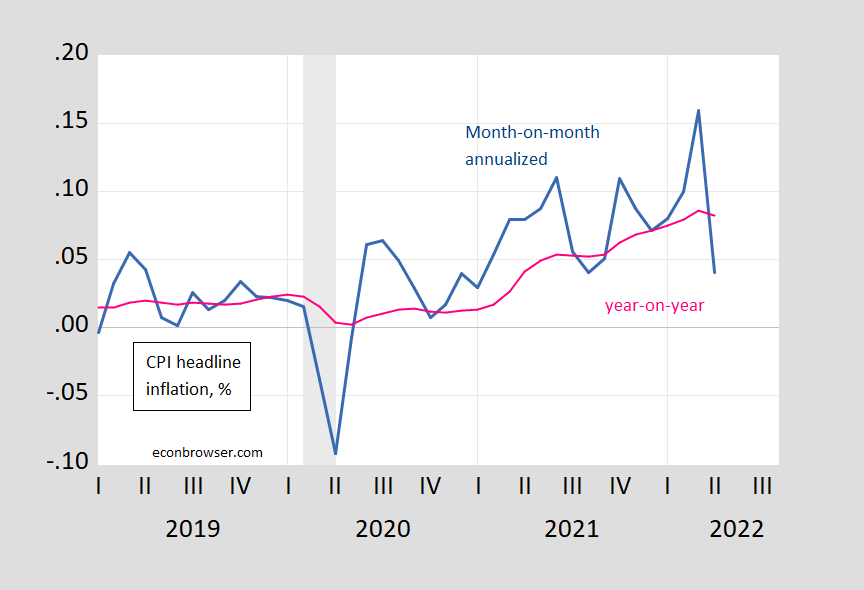
Figure 1: CPI month-on-month inflation rate, annualized (blue), 12 month or year-on-year inflation rate (pink), in decimal form (i.e., 0.05 means 5%). NBER defined peak-to-trough recession dates shaded gray. Source: BLS, NBER, and author’s calculations.
“Base effects” will help going forward, but services inflation (and housing costs) are likely to continue to put upward pressure on headline as well as core.
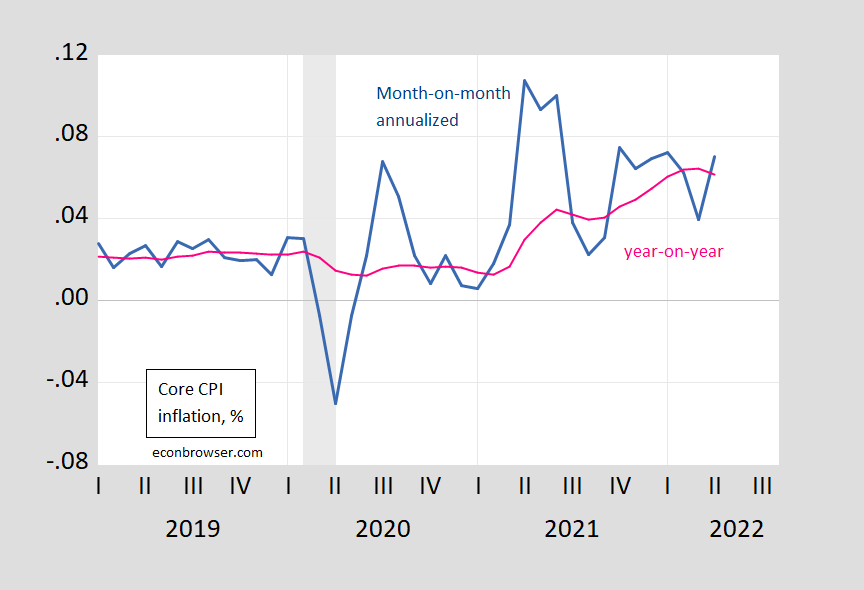
Figure 2: CPI month-on-month core inflation rate, annualized (blue), 12 month or year-on-year inflation rate (pink), in decimal form (i.e., 0.05 means 5%). NBER defined peak-to-trough recession dates shaded gray. Source: BLS, NBER, and author’s calculations.
If both year-on-year inflation continue to go down, we might be in a period of disinflation (as discussed here on Marketplace, this differs from deflation, which is a general decline in the price level).
Finally, we can update the picture on core inflation developments in the US vs. Euro area. In April m/m annualized core inflation was 0.7 ppts higher in the US than in the Euro area, 2.4 ppts on a year-on-year basis. The fact that the m/m differential was smaller than the year-on-year is consistent with a shrinking of the inflation gap, as shown in Figure 3.
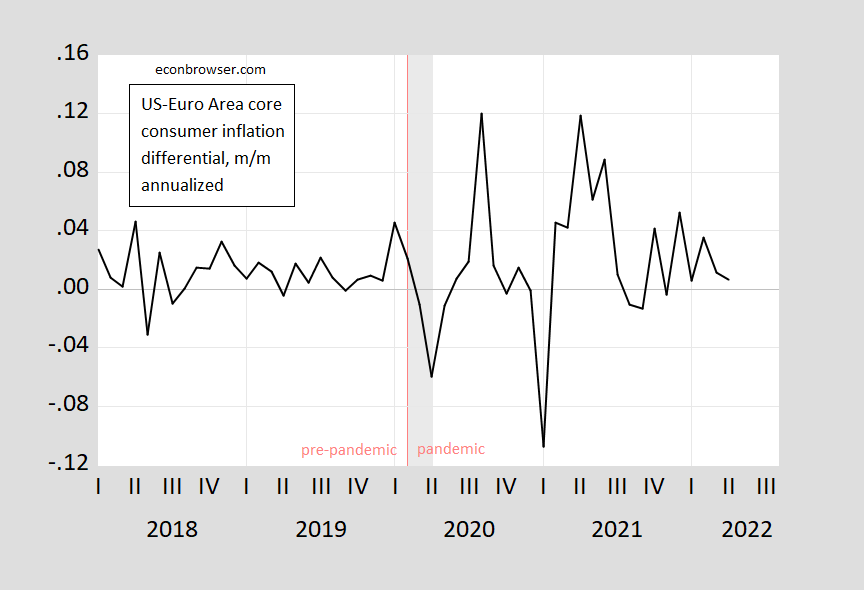
Figure 3: Month-on-month annualized core inflation differential for US=Euro Area (blue), calculated using log differences. Euro Area core HICP seasonally adjusted by author using geometric Census X-12. NBER defined peak-to-trough recession dates shaded gray. Source: BLS, Eurostat via FRED, NBER, and author’s calculations.
Disclosure: None.


