
With Massive Gains Past 3 Months, Bulls Stay Put; Reversal Risks Rising Looking At VIX Futures
Kudos to equity bulls for pulling off an impressive reversal off of late-December lows. Major indices have now rallied for over three months, pushing them into extended territory. Looking at VIX futures, a lot of the good news is in the price already.
Equity bulls keep pulling rabbits out of their hats – so to speak. In so doing, they have perhaps surprised themselves. The rally in US stocks since late December has been nothing short of phenomenal.
After stocks got routed in October-December, even the most ardent bulls perhaps did not expect the three-month loss to be all but wiped out in the following three months. Record highs of last year are now within striking distance.
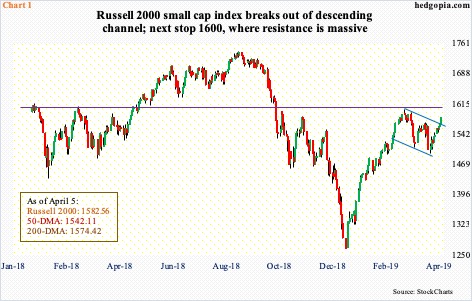
The S&P 500 large-cap index is 1.7 percent from its September high, the Nasdaq 100 index 1.6 percent from its October high and the Dow Industrials two percent from its October high. Of major US equity indices, the Russell 2000 small-cap index is the laggard – still 10.1 percent from its August high; but last week, it scored some technical gains.
In the wake of late-December lows, the Russell 2000 was the only one not to have recaptured the 200-day moving average, which it finally did last Friday. Also last week, the index broke out of a descending channel – bulls hope a bull flag – formed after it was rejected just north of 1600 on February 25 (Chart 1). The latter resistance goes back to January last year. If will be a major victory for bulls should this ceiling be decisively retaken.
Sellers are essentially on strike. Bulls can cite several reasons – ranging from short- to medium- to long-term – to stay put. Continued buildup in US money market fund assets, for instance.
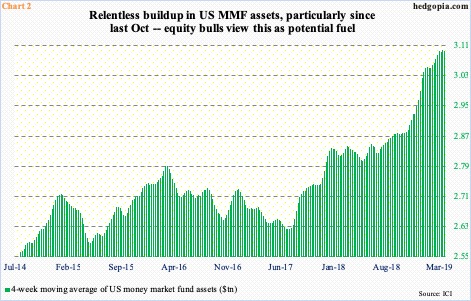
As of last Wednesday, there was $3.1 trillion sitting in these funds, $5.6 billion less than the high from early last month. Between early October last year when stocks began to take it on the chin and late December when they bottomed, money market assets grew by $168 billion. The irony is that the trend did not reverse even after stocks began rising. Since late December, they have gone up by another $68 billion.
Chart 2 uses a four-week moving average, and the buildup in these assets particularly since October is evident. If history is any guide, the question is not if – but when – at least some of these funds find their way into equities. This is what bulls are counting on.
Bulls hope the 1Q19 earnings season becomes the catalyst.
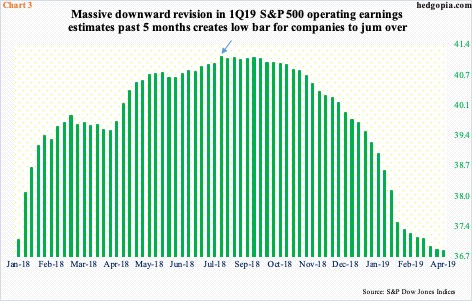
Companies start reporting in earnest this week, with financials leading the way. As of last Thursday, operating earnings estimates for S&P 500 companies stood at $36.82. This compares with $35.03 in 4Q18 and $36.54 in 1Q18. Earnings growth momentum will have softened quite a bit. Although the sell-side expects things to pick back up in the second half this year. For the year, these analysts expect $165.33, up 9.1 percent over 2018. Last year, earnings jumped 21.8 percent and 17.2 percent before that. Next year, earnings are expected to grow another 12.7 percent!
The sell-side habitually starts out optimistically and revises lower as the year progresses. That was the case with 1Q19. In August last year, the quarter was expected to bring in $41.12 (arrow in Chart 3). The massive downward revision gives companies leeway to beat/meet consensus estimates.
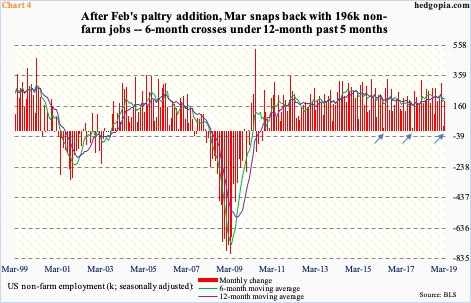
Bulls also cherish the fact that the Fed is out of the way this year even as the jobs machine keeps chugging along. It turns out the much-weaker-than-expected February was a one-month blip. After the upwardly revised 33k non-farm jobs in that month, March snapped back with 196k, for a healthy three-month average of 180k. At least going back to May 2016, there have been two other instances in which job creation ground to a halt but only to come roaring back in subsequent months (arrows in Chart 4). Bulls hope the streak continues.
They also hope average hourly earnings continue to grow in a decent pace but not enough to force the Fed back into the scene. In the last six months, wages grew with a three handle, to $27.70 in March.
With all that said, the economic expansion is less than two months from completing a decade. Several data points are already pointing to deceleration. This includes non-farm jobs, with the six-month average below the 12-month in the past five months.
Bulls are also hanging their hats on a positive resolution of the ongoing trade talks between the US and China. This has dragged on for months now. This could also mean stocks have had ample time to already price this in. Time will tell.
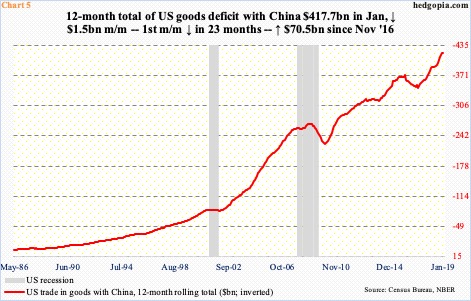
The bigger question is if – big if – a reduction in US trade deficit with China actually results in reduction in the overall deficit or simply results in a change in the makeup. In the 12 months to January, the US ran a goods deficit of $417.7 billion with China, down $1.5 billion month-over-month – first m/m drop in 23 months (Chart 5). Since Donald Trump was elected president in November 2016, the red ink has increased by $70.5 billion.
When it is all said and done, it is entirely possible China’s trade surplus with the US declines, but others such as Vietnam’s rises. In this scenario, longer-term, the overall trade deficit picture does not improve. But from the standpoint of traders’ sentiment short term, it can be a factor, which is what bulls are hoping for.
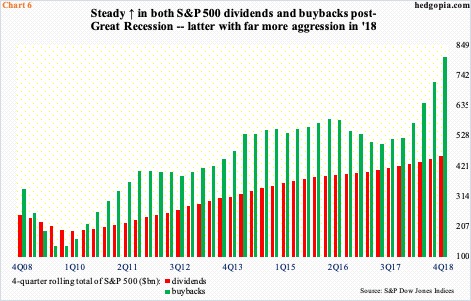
One of the reliable bulwarks keeping this bull market alive has been corporate buybacks, which, thanks to the tax cuts of December 2017, went parabolic last year. S&P 500 companies spent $806.4 billion in buying back their own shares (Chart 6), up from $519.4 billion in 2017. Since the bull market began in March 2009, these companies spent $4.7 trillion in buybacks. This is an astounding number. During the same period, US real GDP expanded by $3.6 trillion (nominal by $6.5 trillion).
Along with buybacks, S&P 500 companies have also been doling out healthy dividends. Since the bull market began a decade ago, $3.2 trillion has been distributed. In 2018, dividends equaled $456.3 billion, up from $419.8 billion in 2017. In 2018, buybacks and dividends together totaled $1.3 trillion. This was the first time the two combined crossed a trillion mark.
Realistically, it is hard to imagine the buyback momentum, in particular, continuing at the same pace as last year. But right here and now bulls are not focused on this, rather on factors such as 1Q19 earnings and trade talks that could provide one more push higher to stocks near term. In this scenario, reversal risk would have substantially risen.
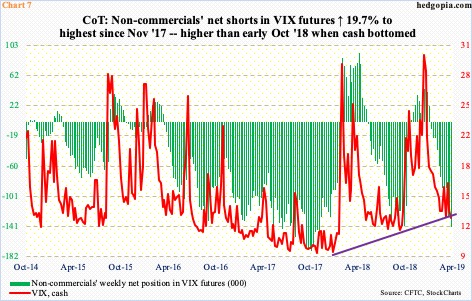
Major US indices are extended, even as VIX went from 36.20 on Boxing Day to last Friday’s low of 12.17. During this, non-commercials switched from 44,245 net longs in VIX futures mid-December to 141,483 net shorts last week.
As those net longs got unwound, the cash (12.82) came under severe pressure. Now, the balance is dangerously getting tilted to the other side. These traders can always continue adding to their net shorts. In October 2017, they were net short just south of 175,000 contracts. But the current holdings are already higher than early October when VIX bottomed and stocks cratered (Chart 7). This is something bulls should keep in mind. Just by looking at VIX futures, a lot of the good news is already priced in.


Why would you only offer non-commerical positions and also not include combined open interest in VIX futures? Where's the extrapolative value in such an offering?