
When Rare Market Data Screams, Listen
Are US stocks going up or down next week? Is the euro or pound trending up or down? What trends do we see in corporate earnings, employment numbers, trade deficits, and GDP numbers? What technical indicators are we following and what do they tell us?
In the financial world there are plenty of pieces of information to follow. Financial information is sought 24/7.
However, there is one set of numbers I rarely see discussed when living through these financial bubbles: very rare market data regarding price.
In this short piece, we will look at why every investor, whether big or small, should be seeking this information constantly. If we were, we would see that rare market price data continues screaming at everyone to stop listening to central bankers and centrally planned schemes on how to keep the bubble up another quarter. This game is now far beyond the 9th inning.
NASDAQ 100, FTSE, and the Pound
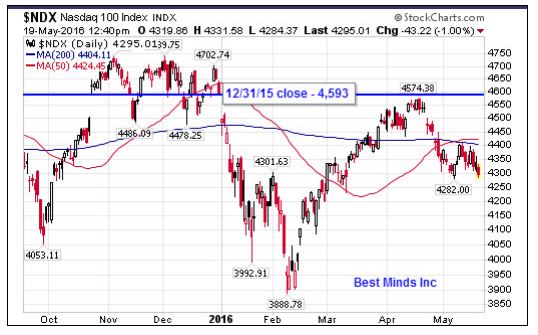
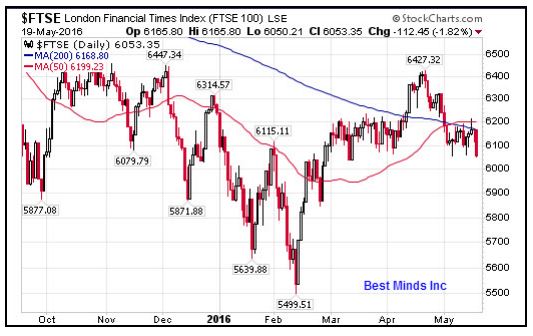
When we look at the Nasdaq 100, we can see that it is currently under its 200 day and 50 day moving average after being above both last month. We can see that the April high did not manage to break above its December 31, 2015 closing price. The FTSE was above its 200 day in April, and today is back under both its 50 and 200.
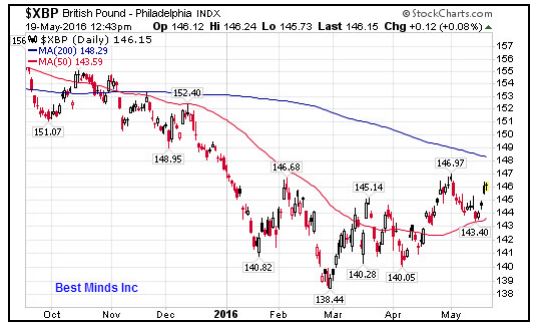
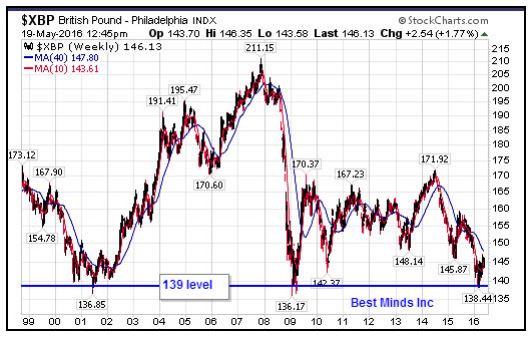
Finally, we can see that the exchange rate of the pound to the dollar was at its lowest over the last 8 months as February ended, and has since moved up above its 50 day, and appears to be heading for its 200 day. All of this is widely seen by market technicians looking for patterns.
However, for someone like myself who focuses on how to keep your bearings when bubbles are deflating and central bankers want to keep up the ruse that “this time is different, we have unlimited schemes available to ‘inflate’ the bubble”, I look for very, very rare data. Let’s take the three major markets above as examples.
On March 27, 2000, the Nasdaq 100 closed above 4700 for the first time. That was the last time as well until November 2, 2105. Whoever says that looking for the top and timing is worthless is a complete idiot based on this one example alone. Looking for a major equity index that has dropped more than 80% in the last 16 years to have another significant drop, seems like common sense.
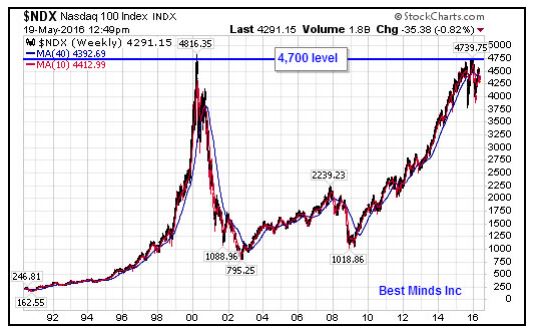
Looking further we see that November 2015 produced five closings above 4700, and December two. This is a total of 8 days in the entire history of the index. If merely looking at the number of trading days since the new century began in 2000, this is 8 days out of more than 4,000 trading days.
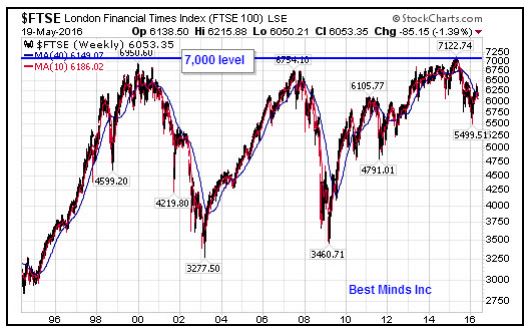
Next we look at the London FTSE index. On December 30, 1999 it closed above 6900 for the first time ever. Once again, it would take more than 15 years to break this level again, closing above 6900 for the second time ever on February 20, 2015.
March, April, and May 2015 produced 23 closes above 7,000; the only three months on record to produce closes above 7,000. On April 27, 2015, the index closed above 7,100, the only day on record to do so.
Next we have the British pound, the oldest currency in the basket that comprises the IMF’s Special Drawing Rights.
A chart of its price levels in 2016 would reveal that this year its exchange rate with the dollar produced two closes under 139. This doesn’t scream rare, until we learn that since the first days of 2000, this price level was seen 6 days in January 2001, 5 days in January 2009, and 4 days in March 2009. This makes the low in February 2016 even more significant, and certainly far outside the ability to use algorithms and press releases to alter price direction beyond a few days or weeks.
The last piece of rare data I have relentlessly brought to the public over the last decade has been a comparison of debt levels to asset price levels. Without a comparison of the two, one is not looking at the larger long-term picture. Yes we are hardwired to boast about investment “success”, yet is this any different from individuals boasting about their image while living beyond their means by increasing debt levels?
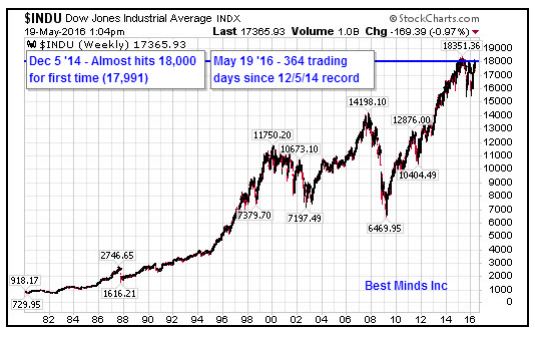
In 1981 the Dow’s high was 1,050. In 1981 the US national debt broke $1 trillion for the first time. In 2015 the Dow reached 18,351 on May 19th, its highest reading ever. The last day of 2015 the US national debt level was 18.9 trillion.
Does there appear to be a connection? See a pattern?
So when we look at debt levels continuing to rise, yet learn a year after the Dow’s all time high that it only closed 11 days above 18,200 in 2015 and one day above 18,300, and these levels were not attained before Q2 2015 or after it, shouldn’t ALL investors, managers, and advisors know this and keep it in mind when charting a course for the next big shift in this giant rollercoaster?
Disclaimer: Be a Contrarian, Remember Your History: If you are reading this ...
more


Interesting. Too bad more people haven't read this. Although the Federal Reserve preaches debt and thinks the solution is more debt, in reality it is not the solution, not has it been. And indeed too much debt leads to problems not solutions. The cycle of leverage and deleverage is a natural one and without deleverage we run into greater and greater dangers.
The simple fact is that many companies and individuals are so leveraged that a 3-5% prime rate would make it obvious that their debt is exceeding their ability to be solvent. Likewise the Federal government would be wallowing in interest payments and would need to curb spending. The Federal Reserve is playing a very dangerous game and is encouraged by government which wants to party on too. If inflation and interest rates rise they will be forced to pay the piper even if the economy doesn't rebound. And if we fall into a recession at this low rate there is little that can be done to help us out given the economy continues to become overleveraged from Federal Reserve games.
Thanks for your comments Moon. If you have ever read Charles MacKay's "Extraordinary Popular Delusions and the Madness of Crowds" (originally published in 1841), you understand that there isn't a lot of thinking going on by the public about these issues. As you so clearly point out, rates at this ultra low level which have already produced the lowest yields in US Treasuries in 200 years, and in British Gilts and German Bunds in 300 years, make it literally impossible to "cut rates" as a resue tool this time. The continued stalling of addressing the real problem (trillions in cheap loans), has only created a more powerful bust. Keep thinking and sharing with those around you who will listen. It has never been more needed.
So true.