What’s The Output Gap? – 2023 Edition

One argument for maintaining tight monetary policy is inflationary pressures — but the question is whether it’s from a positive output gap or cost-push shocks (or expectations). One big question is what is the size of the output gap.
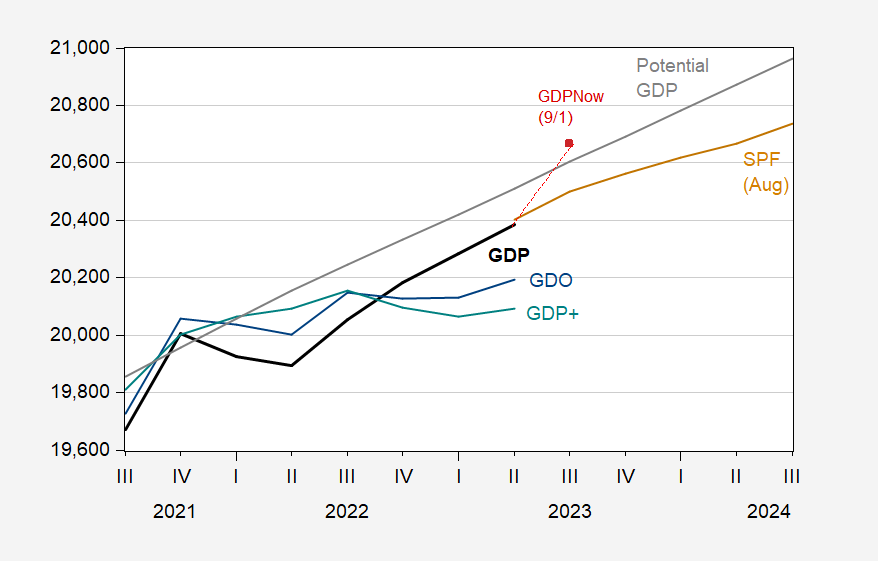
Figure 1: GDP (bold black), SPF median August forecast (tan), GDO (blue), GDP+ (teal), GDPNow of 9/1 (red square), and potential GDP (gray), all in bn.Ch.2012$ SAAR. Source: BEA 2023Q2 2nd release, Philadelphia Fed (GDP+), Philadelphia Fed (SPF), Atlanta Fed, CBO, and author’s calculations.
Note that the output gap as of Q2 was -0.6%, using GDP as reported. Using GDPNow as of 9/1 (a blistering 5.6% q/q SAAR) will set the output gap at essentially zero in Q3. On the other hand, GDO — which is likely to be more reliable than final revised GDP — is at -1.6% in 2023Q2 (GDP+ is at -2.1%).
If the output gap is currently negative, then the case for continued tightening is weak. This is even more so, even taking reported GDP as accurate, if the SPF median is correct and the output gap will be increasingly negative over time.
These calculations rely upon estimates of potential GDP. On this point, there is some disagreement. For instance, as of 2022, CBO’s output gap is 1.2 percentage points of potential GDP less than OECD’s (June 2023 Economic Outlook). The estimate for 2023 is 1.1 ppts lower. Relying upon the OECD estimate implies a better case for tight monetary policy.
For comparison’s sake, 2023Q2 CBO gap is -0.6 ppts, HP deviation is 0.3 ppts, and Hamilton filter is 0.6 ppts.
More By This Author:
Business Cycle Indicators, As Of September 1The Employment Release, News, And Futures-Implied Fed Funds
Velocity, 1967-2023Q2


