What It Would Have Meant If The Fed Had Raised In March
This article provides an impact assessment of the FOMC March 19-20 meeting and a possible rise in the Federal Funds Rate [FFR] to 2.75% at a future meeting sometime later this year.
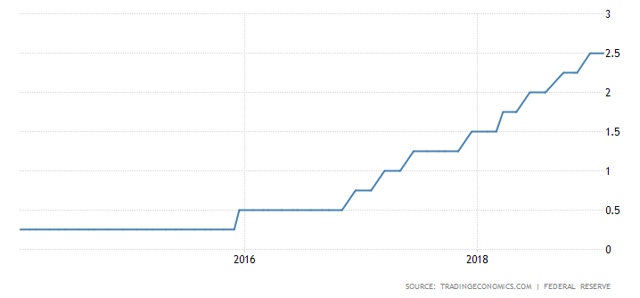
The Federal Reserve held the target range for FFR at 2.25-2.5 percent during its first policy meeting on March 20, 2019, and reaffirmed its position to be patient about further policy firming in light of recent global economic and financial developments and muted inflation pressures.
The current FFR situation is shown in the chart below.
What Happens When The Fed Changes Rates?
A movement of the FFR has three broad impacts:
- Bank lending costs on required reserves.
- Interest burden on private debt.
- Interest on newly issued Treasury deposits.
- Interest paid on excess reserves, also known as the support rate.
These four impacts will be looked at in turn.
Bank Lending Costs
The stock of private debt is shown in the chart below as a percentage of GDP.
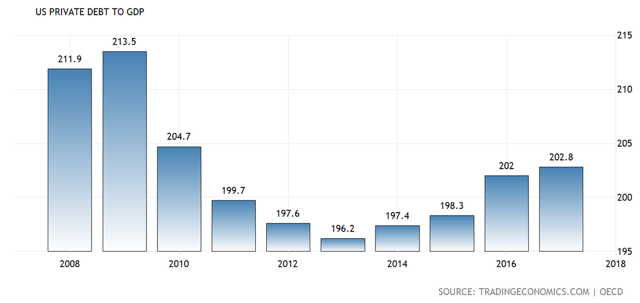
One sees the most current level of private debt-to-GDP is 202.8% for 2017.
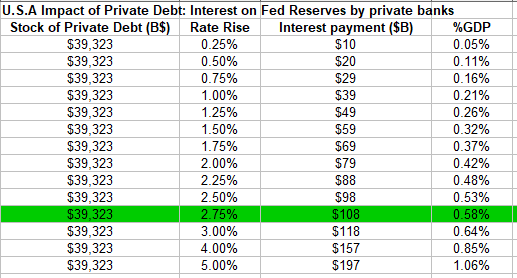
The table below shows the impact of the rate hike on bank reserves advanced by the Fed, via the discount window, when a bank makes a loan.
(Source: Author calculations based on Trading Economics GDP measure)
The next most likely level is shown highlighted in green.
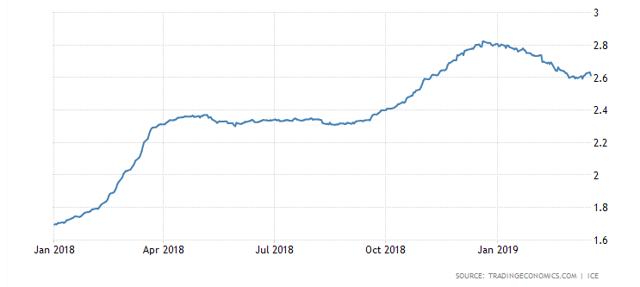
Loans create deposits and generate reserves at the Fed. The Fed creates the reserves on demand as part of the federal payments system. If not able to access reserve funds from other commercial banks on the interbank market, a bank can always access reserves from the Fed at the FFR. The interbank rate is shown in the chart below and shows that at present commercial banks would be better off obtaining their required reserves from the Fed discount window at 2.5% rather than the current 2.6% interbank rate.
Every 0.25% rate movement changes the cost of loan funds by $10 billion. The private banks then pass on this rate change to the customer if they can.
An FFR increase can be seen as a giant, economy-wide tax on borrowers and lenders. Each time the Fed raises 0.25%, it moves $10 billion from the private sector to the government sector.
The Fed is the national government's bank and remits its profits to the national government in the same way that taxes are remitted from the private sector to the government. The national government is the issuer of the dollar; it has as many dollars as it wishes to create, and does not need to get them from an outside source. The $10 billion income stream to the government from a Fed rate rise is deleted from existence in the same way as national taxes. It is a net reduction in the money supply. It exists on no measure of any money supply after remittance, not M1, M2 or M3. This is a contractionary and deflationary impact at the macro level.
Interest Burden On Private Debt
The following table shows the impact of the rate on the stock of private debt in absolute terms and as a percentage of GDP. The likely new FFR is highlighted in green.
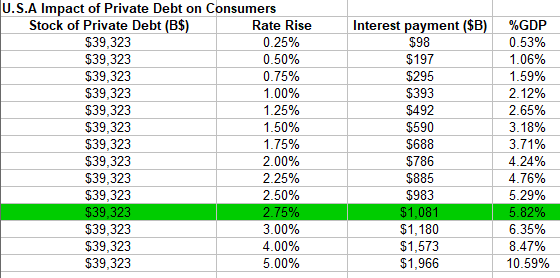
The chart shows that with each 0.25% FFR rise, $98 billion, or 0.53% of GDP, is transferred from the household and business sector to the finance sector in a macro intersectoral income transfer.
At present, just over 5% of GDP goes to banks as interest on loans. Money that might have been spent on real goods and services.
At the macro level, this has no impact on the net money supply, as it stays the same. The biggest impact is the transfer of income from businesses and households to the banking sector.
This transfer of income causes what Professor Michael Hudson terms debt deflation and is also known as secular stagnation.
Debt Deflation: The financial stage following debt-leveraged asset-price inflation, which leaves a residue of debt once new lending stops and repayment time arrives. The term was coined in 1933 by Irving Fisher to explain how bankruptcies and the difficulty of paying debts wiped out bank credit and hence the ability of economies to invest and hire new workers. Paying debt service diverts spending away from consumer goods and new business investment.
- Hudson, Michael. J IS FOR JUNK ECONOMICS: A Guide To Reality In An Age Of Deception (Kindle Locations 1728-1733). ISLET/Verlag. Kindle Edition.
It is this factor that leads to Fed-induced recessions from rate rises.
Treasury Deposits
Another impact of a rate change is on Treasuries (also known as government debt). If there is a general rate rise, then the yield on Treasuries will also rise as new Treasuries issue at the new higher rate and existing ones trade on secondary markets for lower face values.
Under current institutional arrangements, governments around the world voluntarily issue debt into the private bond markets to match $-for-$ their net spending flows in each period. A sovereign government within a fiat currency system does not have to issue any debt and could run continuous fiscal deficits (that is, forever) with a zero public debt.
- Source: Professor William Mitchell, 2015
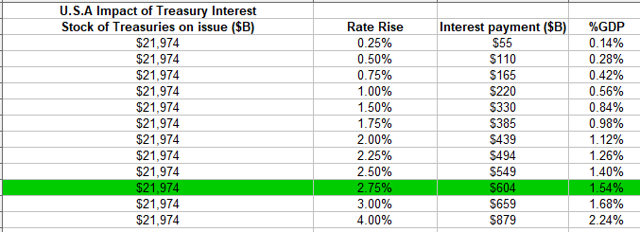
The following table shows the generalized impact of the rate rise on the stock of Treasuries.
(Source: Author calculations based on Trading Economics Government Debt measure)
The next most likely treasury rate is shown highlighted in green.
Government debt in the United States increased to $21974096 million in December from $21850094 million in November of 2018. The debt level is out of date due to the partial Federal government shutdown causing financial reporting such as this to stop.
The table above shows that with each 0.25% rate rise, some $55 billion of new money enters the private sector from the government sector. The positive side of the equation is that more dollars in the economy grow the economy.
The treasury can pay any amount authorized by the national government. A monetarily sovereign national government creates money ad hoc as it spends. It is done simply by marking up bank accounts at the Federal Reserve Bank.
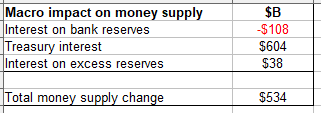
If all the Treasury deposits were at the new rate of 2.75%, then the government would add about $604 billion to the economy each year from treasury interest payments alone.
The entire national debt is a historical record of all the dollars the government spends into the economy that are not taxed back and are currently being held in the form of U.S. government securities, called treasuries. Actually, she said, the national debt clock is an asset clock.
- Source: Professor Stephanie Kelton, 2018
This gives the banks more income. As part of the Fed's monetary operations, it is required to swap bank reserves for Treasury deposits until reaching its target rate of 2.75%.
An interest rate increase may lift the demand for treasury deposits. While domestically this is only a portfolio shift, it might improve the current account balance when foreigners buy more Treasuries, which in turn drives demand for the US dollar. A Treasury is a US dollar with an interest coupon. A US dollar is a zero coupon bond, and the cost of holding it is the interest rate charged by banks on credit money. The USD could well rise as demand for it grows relative to other currencies (UUP).
Interest on Excess Reserves
This is the fourth and last impact of an increase in the FFR.
A phenomenon coming out of the 2007 Global Financial Crisis [GFC] boom/bust was the Federal Reserve would pay interest on excess bank reserves (IOER) held by commercial banks that had beforehand received no interest. This aspect receives almost no press coverage, and yet, the implications are huge.
The chart below shows the stock of excess bank reserves.
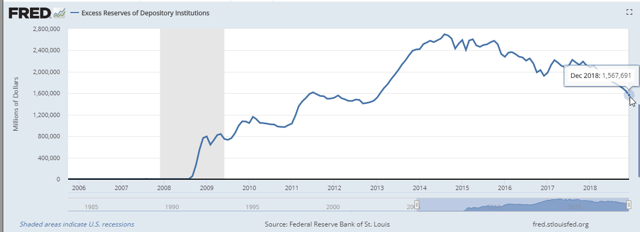
This is over $1.5 trillion.
The chart below shows the interest paid on excess bank reserves.
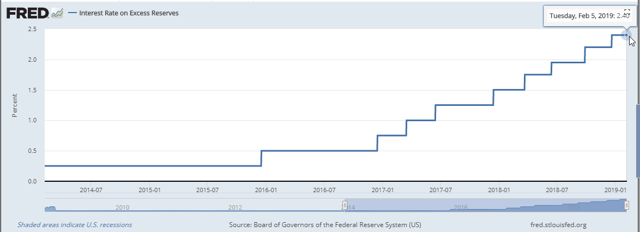
One can see that the interest on excess reserves mirrors the FFR closely. The implications of this are twofold:
1. The FFR will never fall below the IOER; the IOER is a support rate that sets a floor under interest rates. The implication is that instead of setting a target rate and selling and buying Treasuries to achieve the target rate, the same objective could be more easily achieved by setting the support rate where the central bank wanted it to be.
2. Banks receive free money. There are over $1.5 trillion of excess reserves sitting in the reserve accounts of US banks, and this earns them $36 billion per annum of income. This is again money created by marking up bank accounts and is, therefore, high-powered sovereign money as opposed to debt-based credit money.
Each time FFR is raised, the IOER is raised to just underneath it. Most likely an increase in FFR will lead to a rise in the support rate to 2.65%, and this will add a further $3.75 billion of money into the economy and bring the total paid per annum to $39.75 billion.
This income adds to the bank's capital base, which in turn means it can increase its lending if creditworthy borrowers wish for a loan, or it could be paid out in dividends, stock buybacks or lavish executive remuneration.
On Balance, What Does This All Mean?
There are winners and losers from a Fed rate rise.
Banks. On the one hand, banks must pay more for their borrowed reserves from the Fed when they make a loan. This is bad news for those that hold a lot of fixed-rate loans, as their margin gets squeezed. On the other hand, those banks that hold a lot of Adjusting Rate Mortgage (ARM) loans are anticipating or enjoying the triggering of exploding rates that are much more than the actual FFR rise.
Banks slowly devour a larger and larger share of GDP with each rate rise for no additional effort and no actual production of a good or service.
Bank stocks can be expected to rise due to the added income from:
- Increased loan interest from households and businesses on the existing loan book of over 200% of GDP.
- Interest on treasuries bought in exchange for excess reserves by the Federal Reserve.
- Interest paid on excess reserves by the Federal Reserve bank.
Borrowers. They suffer when rates rise and benefit when they fall.
Borrowers in the household and business sector get slowly squeezed with each rate rise. More and more income is devoted to debt service, and the appetite for more debt is reduced.
Aggregate demand falls, and unemployment and recession follow.
The macro-economy
The impact on the macro money supply is shown in the following table:
(Source: Author's calculations based on FRED statistics and Trading Economics dot com statistics)
More money added to the economy grows the economy, especially if matched to value creation and productive capacity. The latter tends not to happen, as the income distribution is skewed to the financial sector, which in turn tends to inflate the value of paper assets instead of creating real assets.
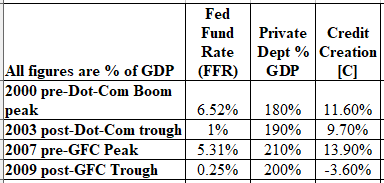
One can have too much of a good thing and the interest rate can go too high, as the table below shows.
(Source: Author's calculations based on Trading Economics dot com statistics)
Five to six percent seems to be the limit, judging from the last two boom/bust events and the amount of private debt.
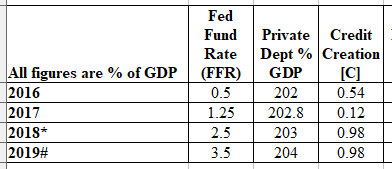
What stands out at present, as compared to the pre-boom peaks of 2000 and 2007, is that credit creation is much weaker, as the table below shows.
(Source: Author's calculations based on Trading Economics dot com statistics)
Perhaps a credit boom is still coming?
Diversified exposure to the American banking system and its many sub-sectors can be obtained via the ETFs listed below.
(XLF) Financial Select Sector SPDR ETF
(VFH) Vanguard Financials ETF
(KRE) SPDR S&P Regional Banking ETF
(KBE) SPDR S&P Bank ETF
(IYF) iShares U.S. Financials ETF
(FAS) Direxion Daily Financial Bull 3X Shares ETF
(IYG) iShares U.S. Financial Services ETF
(FXO) First Trust Financials AlphaDEX ETF
(FTXO) First Trust Nasdaq Bank ETF
(FNCL) Fidelity MSCI Financials Index ETF
(KBWB) Invesco KBW Bank Portfolio ETF
(UYG) ProShares Ultra Financials ETF
(KBWR) Invesco KBW Regional Banking Portfolio ETF
(KCE) SPDR S&P Capital Markets ETF
(KBWP) Invesco KBW Property & Casualty Insurance Portfolio ETF
(DFNL) Davis Select Financial ETF
(PFI) Invesco DWA Financial Momentum Portfolio ETF
(JHMF) John Hancock Multifactor Financials ETF
(RWW) Oppenheimer Financials Sector Revenue ETF
(FINU) ProShares UltraPro Financials ETF
(DPST) Direxion Daily Regional Banks Bull 3X Shares ETF
(FNCF) iShares Edge MSCI Multifactor Financials ETF
I prefer KRE, as it is representative of domestic U.S. banks, which enjoy the full benefit of the rate rise. These can be bought on the prospect of a Fed rate rise and then sold.
The Fed stayed its hand and this means that the expansion has been prolonged by three months.


You can view more of my work here seekingalpha.com/.../alan-longbon#regular_articles