
Last Monday the stock market (SPX) fell by nearly 3%. We don’t really know why it fell although there are plenty of people who are ready, willing and able to provide you with an “explanation”.
I can calculate the movements of the heavenly bodies but not the madness of people.
Sir Isaac Newton, upon losing a fortune on South Sea Company stock
Newton’s Laws of Motion
- An object at rest remains at rest, and an object in motion remains in motion at constant speed and in a straight line unless acted on by an unbalanced force.
- The acceleration of an object depends on the mass of the object and the amount of force applied.
- Whenever one object exerts a force on another object, the second object exerts an equal and opposite on the first.
There’s the Yen carry trade unwind which says that leveraged speculators who had borrowed in Yen were caught off guard when the Bank of Japan raised rates by 0.15% despite the fact that the BOJ has spent months preparing the market for exactly that. Those speculators were supposedly using their borrowed Yen to buy US stocks and other risky assets and so had to sell those assets to repay their Yen loans. While I generally agree with that assessment, there are some problems with it, namely that there is little evidence that is actually what happened. We don’t get real time information about non-bank Yen lending to hedge funds. In fact, we never really get that information although it can be inferred – sort of – from other reports.
I would also venture to say that the vast majority of pundits using this explanation have never met a trader doing this trade. I’ve been doing this for over 30 years and I’ve only known a few who were doing it knowingly. What I mean by that is that in many cases the individual traders within a hedge fund have no idea the source of the capital they’re trading; that’s above their paygrade. Did the Yen carry trade have anything to do with the selloff in US stocks? Probably. There has certainly been a covering of Yen shorts in US futures markets which is about the only thing we can really confirm. And, by the way, the short covering started in mid-July right about the time the S&P 500 peaked, although that could just be coincidence. Does that mean the Yen carry trade is over? Probably not since the biggest structural short in the Yen is from Japanese households buying higher yielding foreign assets. Last I checked, yields outside Japan are still a lot higher than inside.
The other popular explanation is that recession fears have started to rise because of a few weak economic reports. That looked very plausible when the 10 year rate was dropping rapidly and expectations for multiple Fed rate cuts were rising. The 10 year yield had dropped 39 basis points from July 31st to August 2nd and fell another 13 basis points last Monday morning. But by the end of the day, bond yields were flat and they closed the week up 15 basis points from the Friday close. At one point Monday, the market was pricing a better than 50/50 probability that the Fed would deliver a full 1% cut in the Fed Funds rate by the end of the year. By the end of the week, the only rate cut with better than even odds was for a 0.25% cut in September and that only showed a 51.5% probability. Did the economic outlook change that much in just a week?
One final explanation of the selloff is that earnings momentum for the AI stocks or the Magnificent 7 or Large cap growth stocks (or all of the above) has peaked and that without a clear path to profits from all this AI investment, investors are selling first and asking questions later. It is certainly true that earnings growth expectations for large cap growth stocks appear to have peaked (as I’ve pointed out numerous times over the last couple of months). But this explanation loses a lot of its appeal when you recognize that small and midcap stocks sold off as much as large cap (measured from the S&P 500 peak on July 16th) and their earnings expectations – and actual earnings – are rising.
Everyone wants an explanation for why markets move the way they do but as Isaac Newton found out the hard way, you can predict the motion of the “heavenly bodies” but you can’t predict the emotions of people. In the short term, the market moves on fear and greed and you can’t predict in advance which emotion will dominate. Why have stocks corrected a bit over 5% since mid-July? Probably all of the above plus some things we haven’t even considered. The bottom line is that people got afraid of losing money and they sold in an attempt to prevent it or minimize it. We can’t possibly know what exactly created that fear in each trader/investor and frankly it doesn’t matter. The “reason” may well – likely will – prove ephemeral or it may just be wrong. Or more likely, the “reason” was just something the investor invented to make themselves feel okay about doing what they wanted to do anyway.
Newton’s laws of motion actually do offer some pretty good advice for investors.
- Markets in motion tend to stay in motion. Bull markets keep rising, bear markets keep falling.
- Trends change (accelerate or reverse) when there is significant news that further validates or invalidates the reason for the trend. “Significant” is the key word in that sentence.
- Changes in one market produce changes in other markets.
There is no way to predict the emotions of people but we can observe them and know that opportunity is found in the extremes. Market sentiment had gotten too exuberant by the first half of July (but not nearly as exuberant as we’ve seen at times in the past), a reversal was inevitable and we got it. Monday, after just a few weeks of selling, we reached another extreme in the opposite direction (but not as dour as we’ve seen at times in the past). The volatility index rose to over 60 Monday morning, an extreme by any measure of history, a reversal was likely and we got it. And sentiment remains fairly negative, unless this is a new bear market (which seems unlikely), which makes me think the correction may already be over. One word of warning though. There’s a lot of important economic data this week (CPI, PPI, Retail sales, two regional Fed surveys, industrial production and housing starts) and there is always the potential for a market moving report(s). If you’re a buyer, be deliberate and incremental and don’t let greed overwhelm your good sense.
What Sir Isaac Newton didn’t understand about investing is that it doesn’t matter that you don’t know the motivations of others as long as you know your own. Don’t get too greedy and don’t get too fearful. The easiest way to do that is to back away, take a longer view. If you fell asleep 20 months ago and woke up last Friday the 10 year Treasury yield would be no different than it was when you nodded off. The economy is not significantly different right now than it was then despite some ups and downs along the way. If you fell asleep in June and woke up last week, the stock market would be in about the same place too.
And if you were Isaac Newton and you awoke from the dead, you’d find out that you miscalculated a lot more than just the madness of people. The next time you think you know what’s going to happen in the economy or markets, ask yourself: Am I smarter than Isaac Newton? Unless your last name is Einstein, the answer is probably no.
Environment

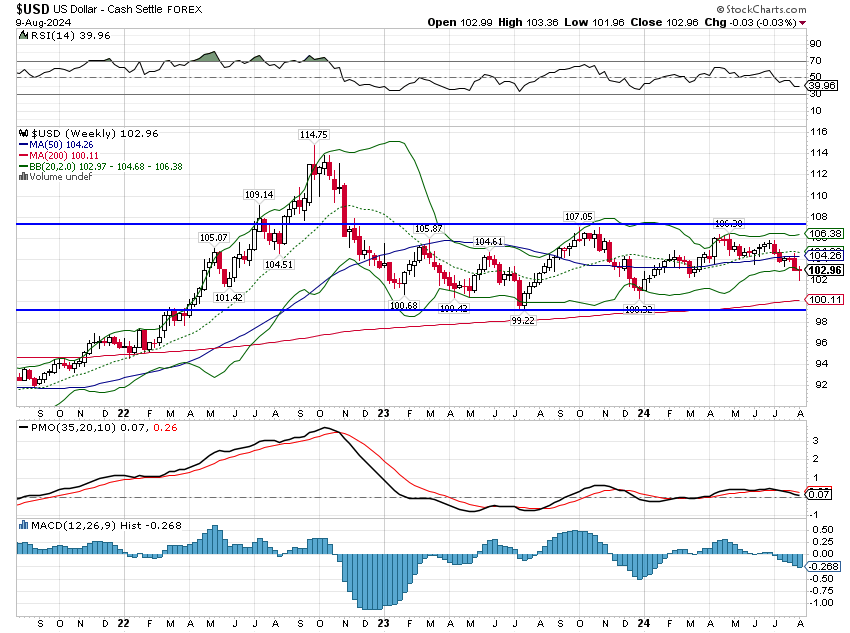
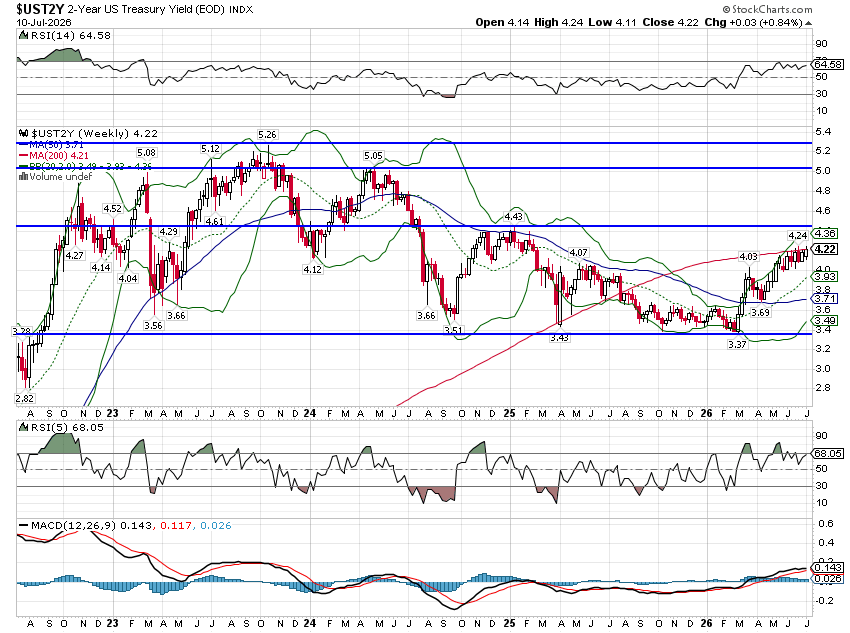
Interest rates rose last week and the dollar was unchanged. Both are still in short term downtrends but trading within the range of the last 20 months. Both are essentially unchanged over that time, a remarkable stability given all that has gone on during that time.
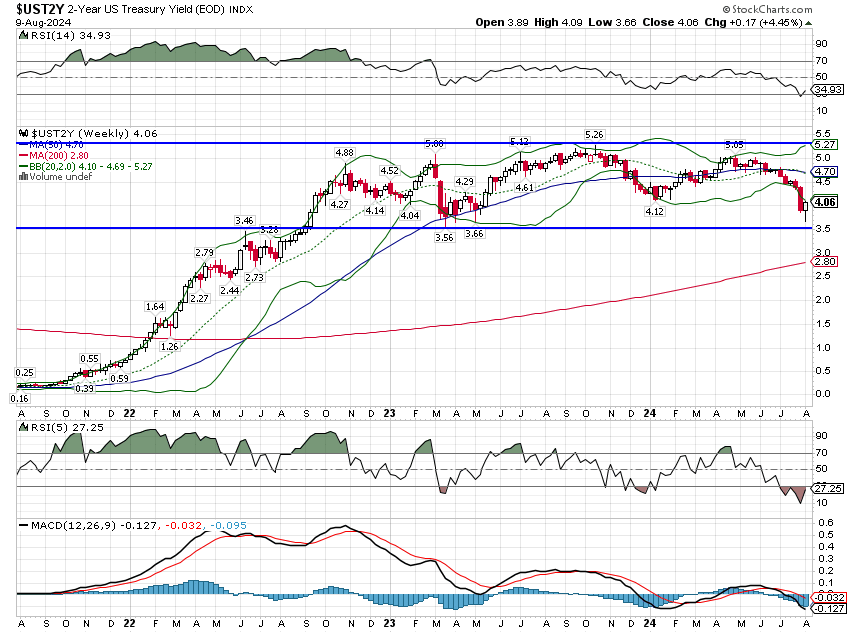
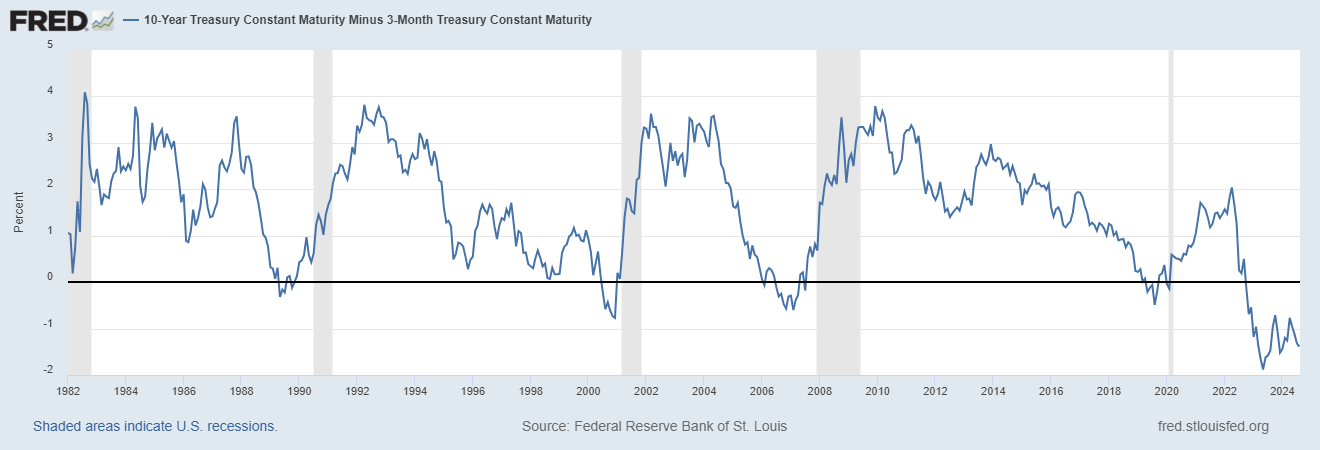
Shorter term rates like the 3 month TBill rate haven’t fallen as much as the 2 year because the Fed has not yet committed to a near term rate cut. The result is that the 10 year/3 month yield curve is more inverted now than it was in April. What does that mean? It means, we probably have more time to recession than the crowd currently believes. The 10 year/3 month curve has normalized before each of the last 4 recessions with an average lead time of about 5 months but we aren’t even close at -1.39%. There has been some attention paid to the fact that the 10 year/2 year curve turned positive briefly last week, but that can happen as much as a year in advance of recession. It has also stayed inverted until the start of the recession but I think we have to be careful about putting much faith in these past episodes. Remember, the recession start date is chosen well after the fact and the committee that makes those decisions today isn’t the same one that made that decision in 1980. There are going to be differences.
The markets continue to reduce future nominal growth expectations, but a recession would likely see considerable downside to short and long term rates. But for now, the trend hasn’t changed and there is no credible trading signal to take on longer duration bonds.
Markets
Despite a lot of cross asset volatility, all the major asset classes in our diversified portfolios are up YTD. All but one – commodities – are up for the last year. And within the commodity allocation, gold has outperformed even the S&P 500 YTD and in the trailing one year rankings. The last 3 years has been more difficult, with bonds and REITs – interest rates sensitive assets – down and small cap stocks up less than 2%/year. The best performing asset over that time is commodities which, as a diversifying asset, rarely holds a large position in your portfolio. The last 3 years was somewhat better for value stocks regardless of size with small and midcap growth stocks down over that period. Owning any non-US stocks did nothing but lower your overall return. It hasn’t been a fun 3 years.
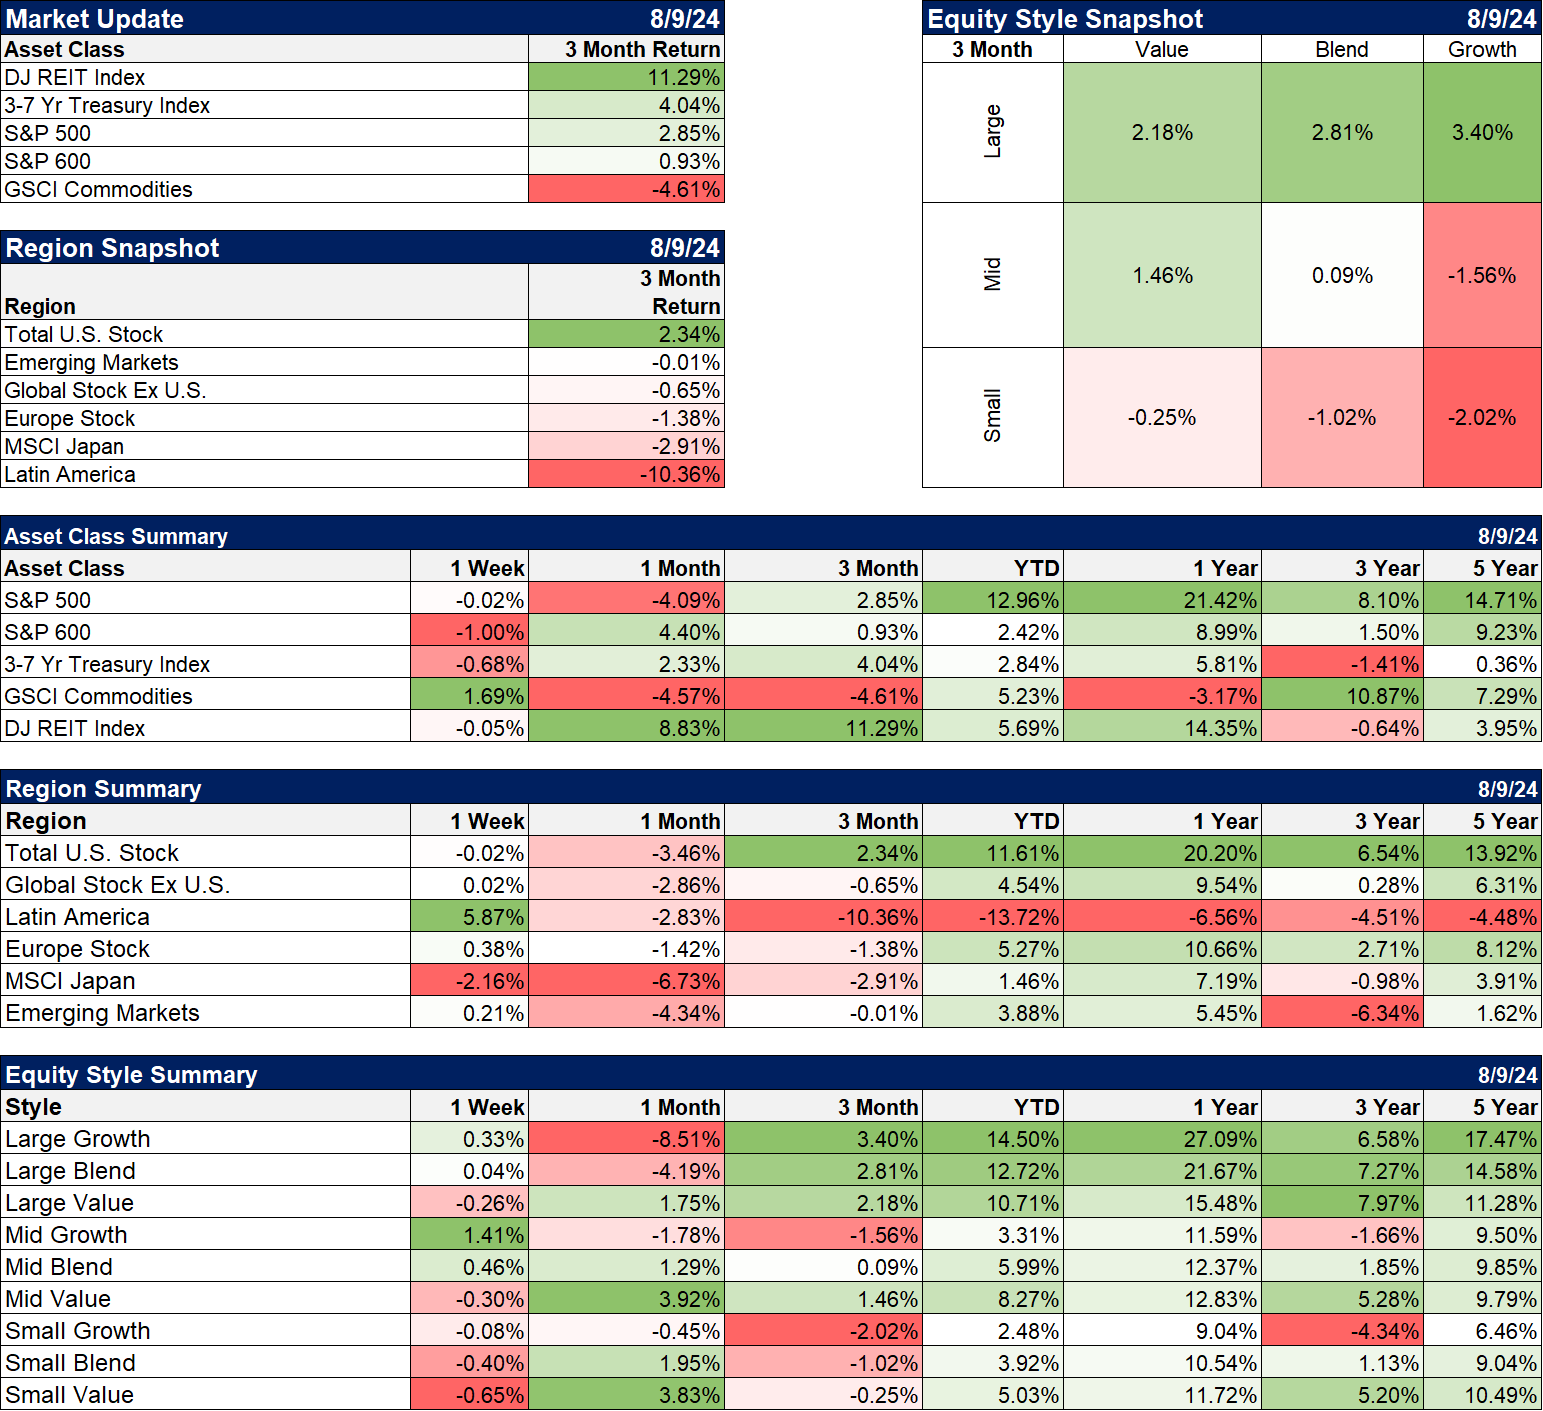
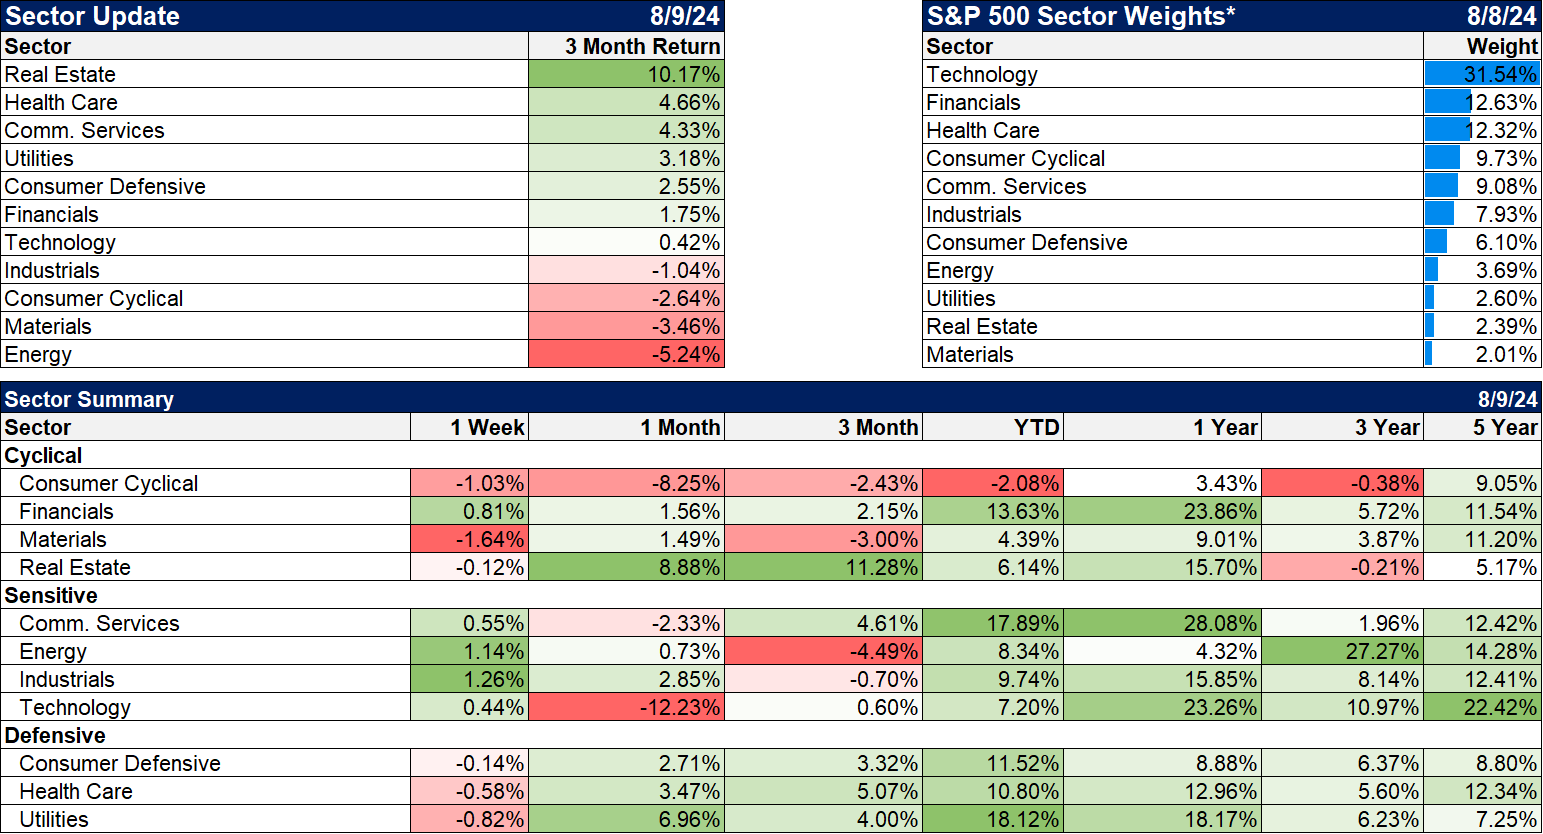
Sectors
The last three years has been even tougher from a sector standpoint with only Energy and Technology outperforming the S&P 500 over that time; industrials matched the market return. When will that change? Maybe soon because earnings growth has started to broaden out with non-tech earnings rising this quarter.
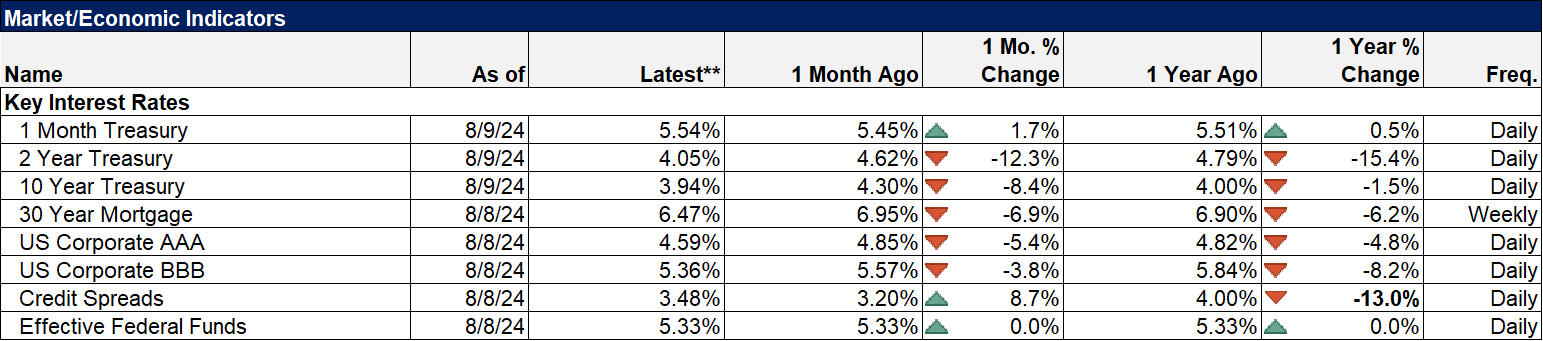
Market/Economic Indicators
The economic calendar was light last week and the reports were generally positive. The most important report of the week was one that usually doesn’t move markets much – weekly initial jobless claims. The week before claims jumped to 250,000 and the market seemed to take that as proof that the economy was failing rapidly. But as I pointed out last week, that level isn’t anything special; we were actually higher last summer. So, last week’s report was in the spotlight and it didn’t confirm the reading of the previous week. Claims fell back to 233,000. And frankly, that reading doesn’t change anything either. Everyone looking at employment to try and gauge the likelihood of recession is looking in the wrong place anyway. Employment is a lagging indicator; companies lay people off after business slows down, not before.
This week’s calendar, however, is full of interesting and potentially market moving reports:
- Tuesday: PPI – PPI is expected to rise 0.1% while the core is expected to be up 0.2%
- Wednesday: CPI – CPI is expected to rise 0.2% and core the same. I think there is the potential for a negative surprise here. The Cleveland Fed nowcast for inflation has headline up 0.24% and core up 0.25%. The first would round down to 0.2% but the latter would be rounded up 0.3%. Neither of those roundings really mean anything but markets move these days on headlines, not subtle analysis.
- Thursday: Retail sales (+0.3% expected), export prices (-0.5%), import prices (0.00%), Empire State Mfg. survey (-6), Philly Fed Mfg. survey (7), jobless claims (232k), Industrial Production (+0.1%) and the Housing market index (43).
- Housing starts (unchanged) and building permits (unchanged), U of Michigan Consumer Sentiment (who cares?)
Credit spreads widened during the stock market correction but are already off their highs and below last year’s level.
More By This Author:
Wall Street Casino CrazinessMarket Morsel: SLOOSing
Weekly Market Pulse: Whiplash


Comments
Log in or sign up to join the conversation.