
WEI accelerates, while WECI decelerates.
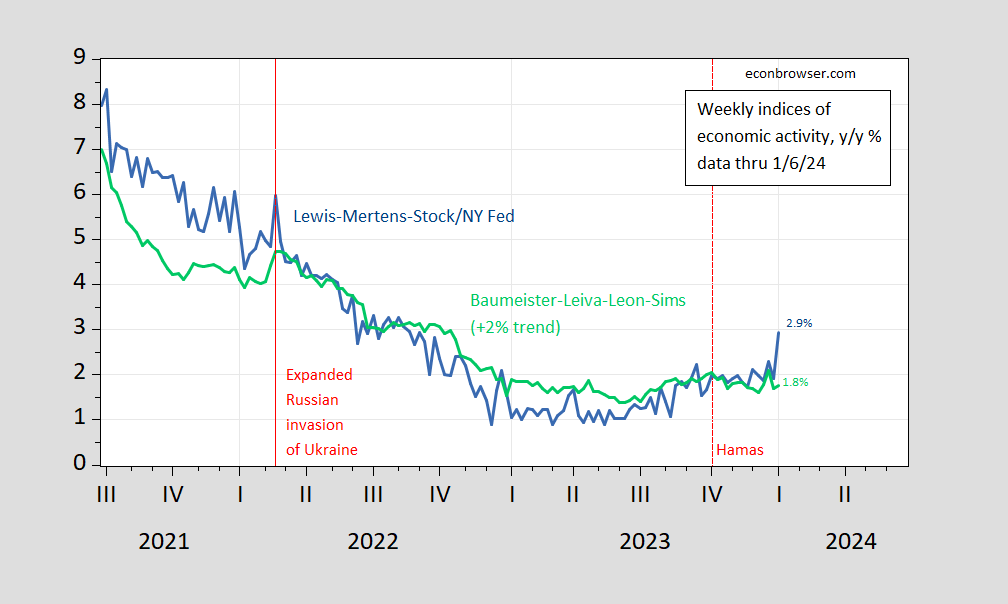
Figure 1: Lewis-Mertens-Stock Weekly Economic Index (blue), and Baumeister-Leiva-Leon-Sims Weekly Economic Conditions Index for US plus 2% trend (green), all y/y growth rate in %. Source: NY Fed via FRED, WECI, accessed 1/11, and author’s calculations.
The WECI+2% thru 12/30 is 1.77%, while WEI reading is 2.94%. The latter is interpretable as a y/y quarter growth of 2.94% if the 2.94% reading were to persist for an entire quarter. The Baumeister et al. reading of -0.23% is interpreted as a 0.23% growth rate below the long term trend growth rate. Average growth of US GDP over the 2000-19 period is about 2%, so this implies a 1.77% growth rate for the year ending 1/6.
Recall the WEI relies on correlations in ten series available at the weekly frequency (e.g., unemployment claims, fuel sales, retail sales), while the WECI relies on a mixed frequency dynamic factor model.
More By This Author:
FX Reserve Holdings – 50 Years Of DataInflation Nowcasts And Expectations
Are We In Recession? The Sahm Rule Now & 2007


Comments
Log in or sign up to join the conversation.