
What a difference a day makes! After a two-week correction of nearly 5%, the S&P 500 spent the first part of last week rallying in anticipation of a friendly Fed meeting.
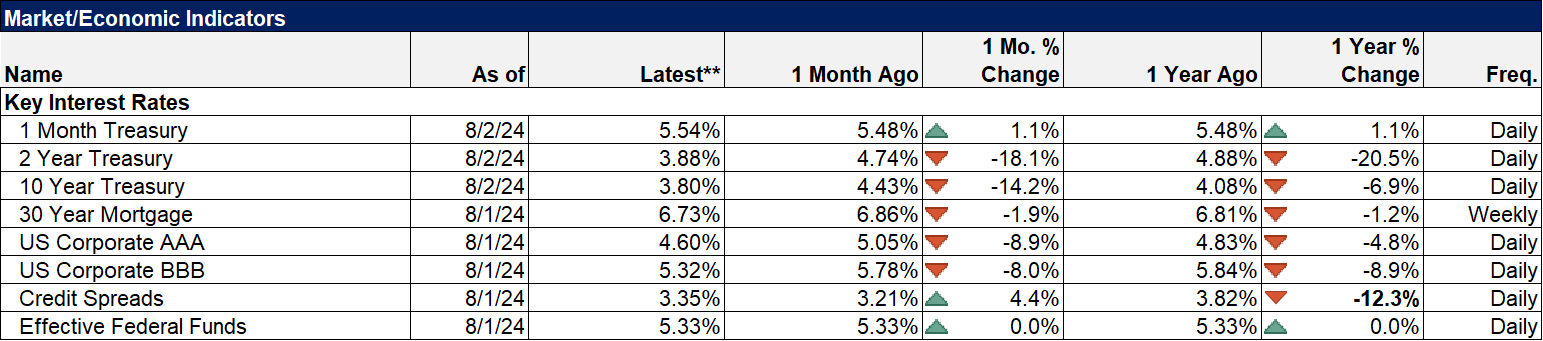
That Fed meeting Wednesday produced the expected, namely that a rate cut in September was likely. That pushed the S&P 500 up over 2% from the Fed meeting to the high the following day. Small and midcap stocks moved in the same general direction as the large caps but with wider swings. Then…everything went down in a straight line. The S&P 500 fell 4% from Thursday’s high to the close on Friday; the Russell 2000 index of small stocks fell 8.6%. The totals weren’t that bad for the full week with the S&P down 2.1% and the Russell down 6.8%. Bonds also had a wild week with the 10 year Treasury yield down 41 basis points and the 2 year Treasury down 50 basis points on the week. Credit spreads also widened but only about 25 basis points and are still below the highs of the year and way below the levels of last year.
So, what changed between Thursday morning and Friday afternoon? The explanation offered by most commentators is that all of this was due to fears of recession, produced by three economic reports released after the FOMC meeting:
- Initial jobless claims – Claims rose 14,000 to 249,000 from last week’s 235,000.
- ISM Manufacturing PMI – The index fell to 46.8 from last month’s 48.5. Employment and new orders also fell while prices rose slightly.
- The employment report – The economy added just 114,000 jobs last month, down from 216k in May and 179k last month.
Seen in isolation, it is obvious that these reports all seem to point to a slowing economy, but in context they don’t look all that special.
- Jobless claims were 245,000 just two weeks ago and didn’t induce any kind of reaction in the market. Claims were also higher last summer: 261k in June of ’23 and 258k in August. They have been rising all year, starting the year just under 200k, but other than the COVID recession, we haven’t had a recession start with claims under 300k since 1973 when the civilian labor force totaled around 90 million vs over 168 million today.
- The ISM manufacturing PMI has been below 50 (denoting contraction) for 20 of the last 21 months. The manufacturing sector is still trying to recover from the COVID supply chain issues. Wholesalers and retailers both overstocked during COVID and they have been working down inventories for the last two years (which is why this indicator has been negative for 20 of the last 21 months). Inventory to sales ratios have come down but apparently not enough to set off a restocking cycle just yet. I would also point out that this indicator, like the part of the economy it covers, is very volatile. It often prints below 50 during an economic cycle without a recession.
- The number of jobs added on a monthly basis is basically just a guess and I don’t know why so many investors take it so seriously. The numbers will be revised several times before the final reading that will come with the annual benchmark revisions in January next year. The monthly number is only accurate to + or – 100,000 jobs. So the actual number could ultimately be over 200,000 or near zero. Furthermore, this wasn’t even the worst month of the year. That was April’s 108k although to be fair that was initially reported as +175k. See how those revisions work? The unemployment rate did rise to 4.3%, up from the cycle low of 3.5% last July. However, the unemployment rate rose primarily because, according to the Household Survey, the work force grew by 420,000 last month and the number of employed only rose 67,000. But that 420k number is way above the average since 2022 of 194k/month. Longer term, the average is even lower, about 100k per month dating back to the 1990s. So the unemployment rate may be rising but it’s probably being overstated.
So if it wasn’t the economic reports, what was it? I don’t really know but large moves in such a short period of time are often associated with unwinding of leveraged positions. One potential culprit in last week’s selloff – and maybe the selloff in the large caps and tech stocks since July 10th – is the Yen carry trade. Hedge funds and other leveraged players have been borrowing in a low yielding, depreciating Yen and buying other, higher yielding assets. That includes places like Mexico and Brazil but it also includes trades in the US stock and bond markets. Expectations for a rate hike from the Bank of Japan have been rising and were vindicated when they did exactly that on Wednesday last week. It wasn’t much of a move – about 0.15% – but it is the direction that matters. With the Fed raising hopes for a cut in September, the spread between the two yields is narrowing. The biggest impact has been in the forex markets where the Yen is up over 10% since July 10th with nearly half of that coming from Wednesday to Friday last week.
A leveraged fund that has been short Yen and long EM currencies started to get hurt in late May when the Mexican Peso plunged after the election there. The Brazilian Real has been falling since the beginning of the year but accelerated to near the 2021 low in July. Now with the BOJ in a rate hiking cycle and the Fed about to embark on a rate cutting cycle, the Yen is rising rapidly, hurting the other side of the trade. This may have just been the culmination of several bad months for these funds.
Market sentiment has turned negative very quickly with the VIX (volatility index) rising to near 30 Friday before closing at 23 and change. A VIX over 30 has been a reliable buy signal in the past, although higher readings are sometimes needed for full blown bear markets. But getting there so quickly in such a mild correction would seem to indicate some extreme nervousness on the part of investors. Put/Call ratios also rose last week indicating an urge to hedge portfolios and the high VIX showing a willingness to pay up for it.
I don’t think the economic outlook changed all that much last week although I will admit that I’m more nervous about the economy now than I have been during this entire COVID recovery. I am not a big believer in the power of the Fed but I think they should have started cutting rates two meetings ago. That’s when the Taylor rule indicated the need for a cut and it hasn’t changed. But the market is providing what the Fed hasn’t; with the 10 year rate coming down so have mortgage rates with the average 30 year hitting 6.375% last week and the 15 year falling to 5.89%. Those are the lowest rates since the spring of last year and well down from the 7.5% the 30 year hit last fall. Mortgage rates are still elevated relative to the 10 year Treasury as well so they could continue to fall. I can’t imagine that won’t have a positive impact on housing market activity.
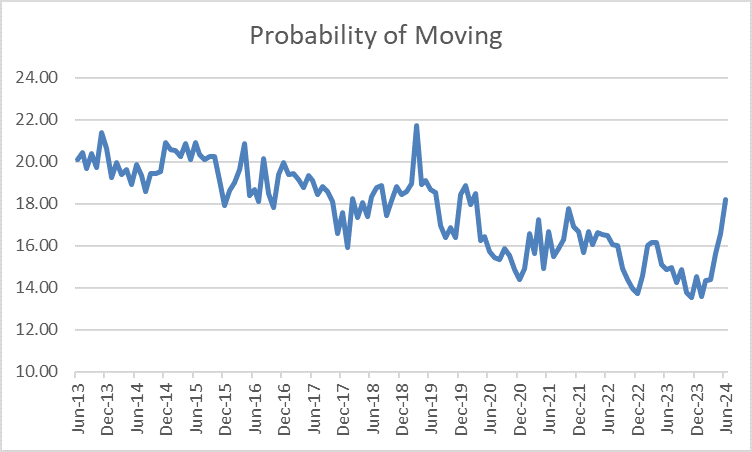
The biggest impact in the economy from the Fed’s rate hikes has been on housing and associated sectors. One of the reasons durable goods sales and orders have been stagnant is because of the stasis in the housing market. Homeowners with low mortgage rates were unwilling to sell and buyers were unwilling to buy with rates this high. But that was starting to ease even before rates started falling in earnest. Existing home inventory has been rising and new home inventory is at a 14 year high. The probability of moving is also rising and nearly back to the pre-COVID level. Regardless of mortgage rates, people’s lives change and sometimes that involves moving (change of job, retirement, etc.).
From the New York Fed’s Survey of consumer expectations:
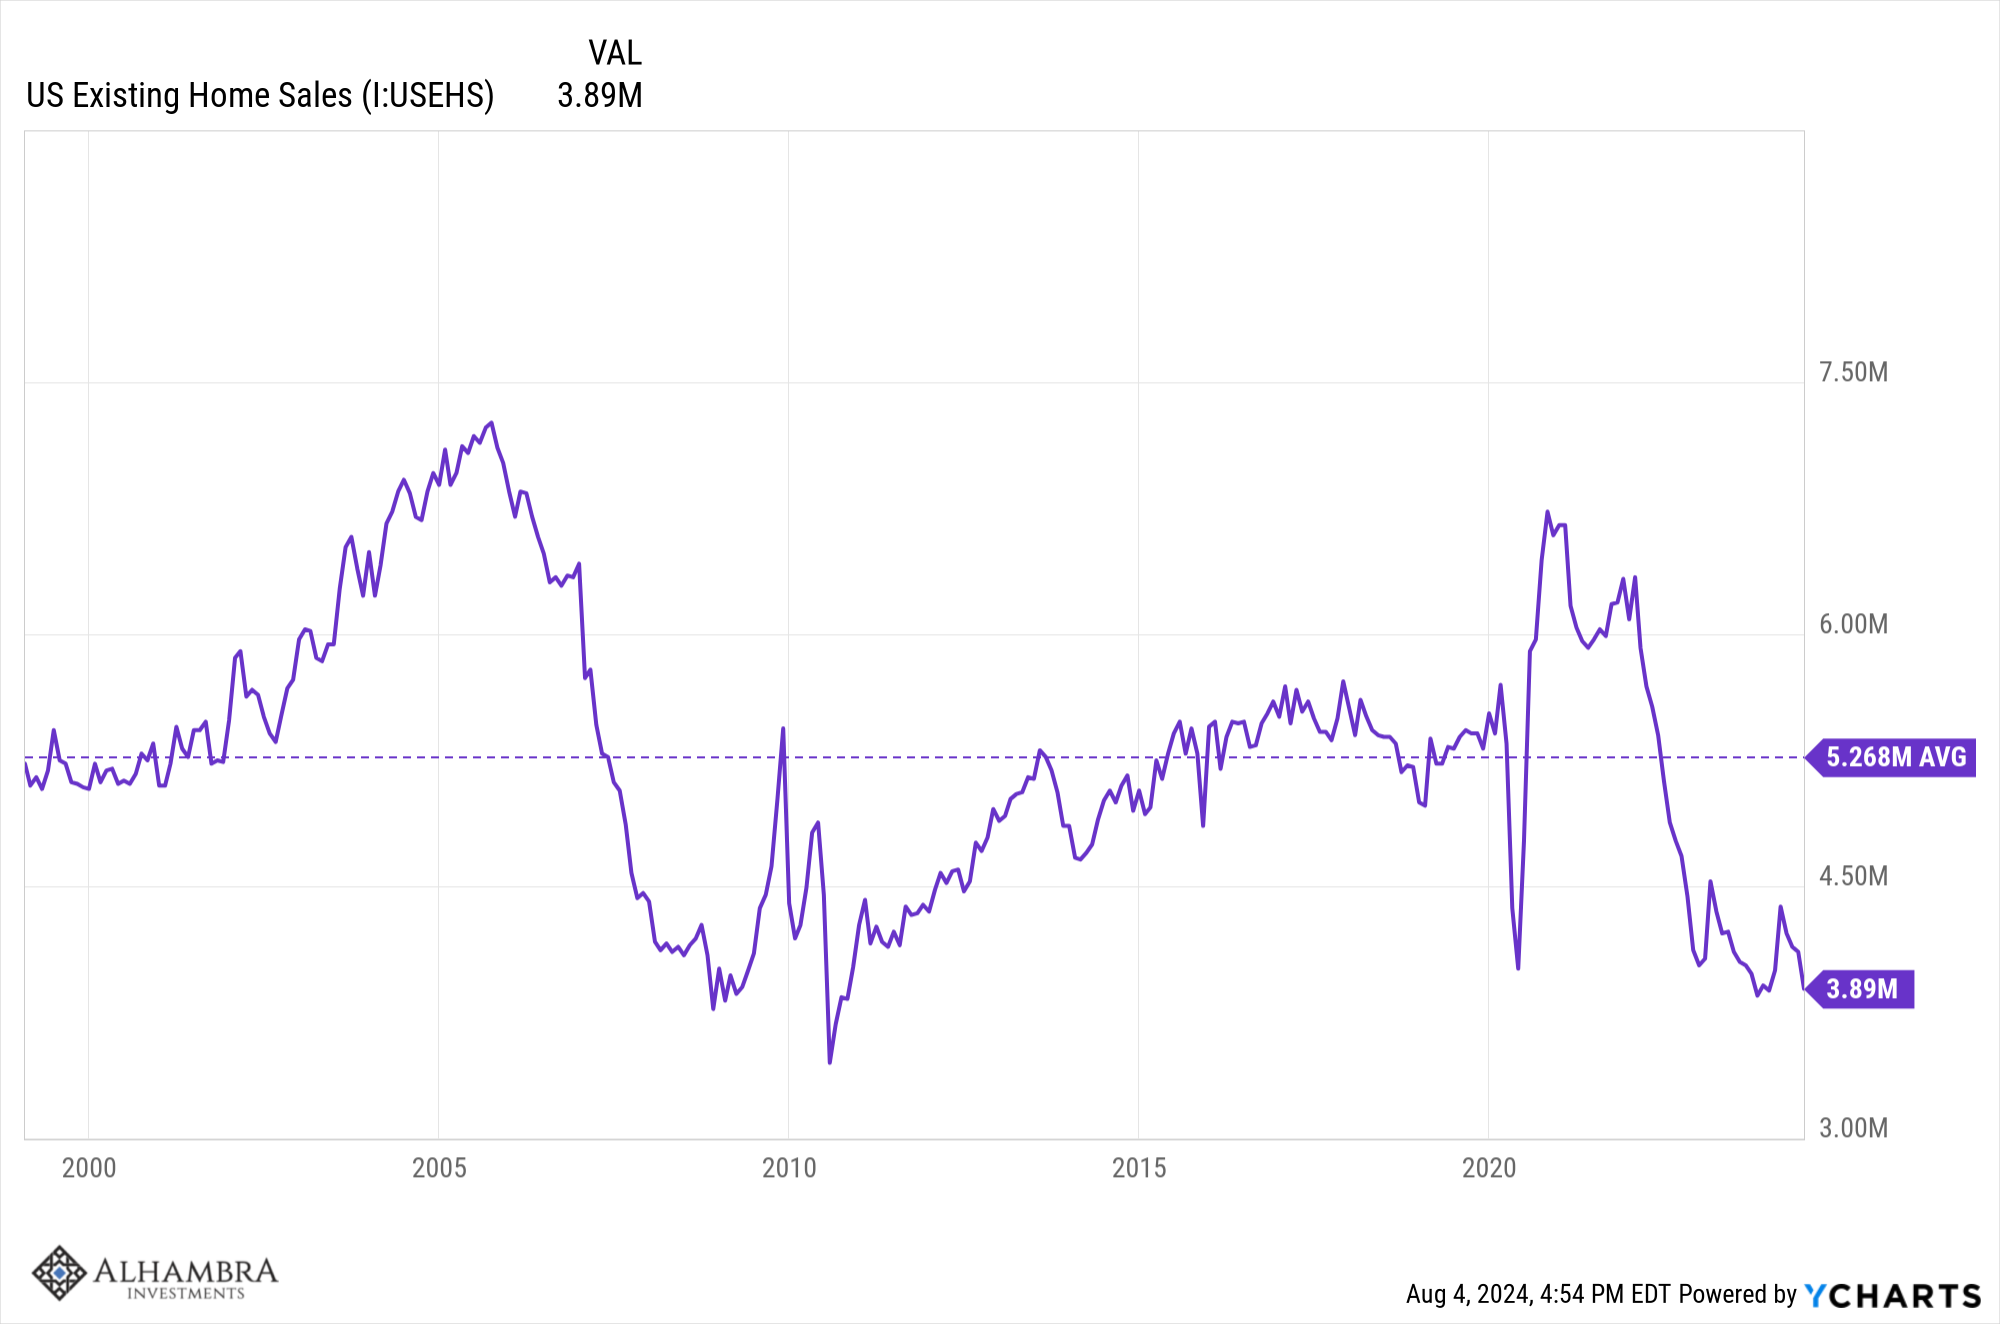
If the economy has been slowing because of higher rates, then lower rates ought to cure it. Economies are, to some degree, self-healing and while the Fed may not be ready to cut rates, the market has already taken care of that to a large degree. As I’ve said many times, the Fed is a follower of the market, not a leader. Can the housing market – and commercial real estate – turn around fast enough to keep the economy out of recession? I don’t know but with current existing home sales annualizing under 4 million and the average since 2000 at 5.3 million there is a lot of room for improvement.
Environment

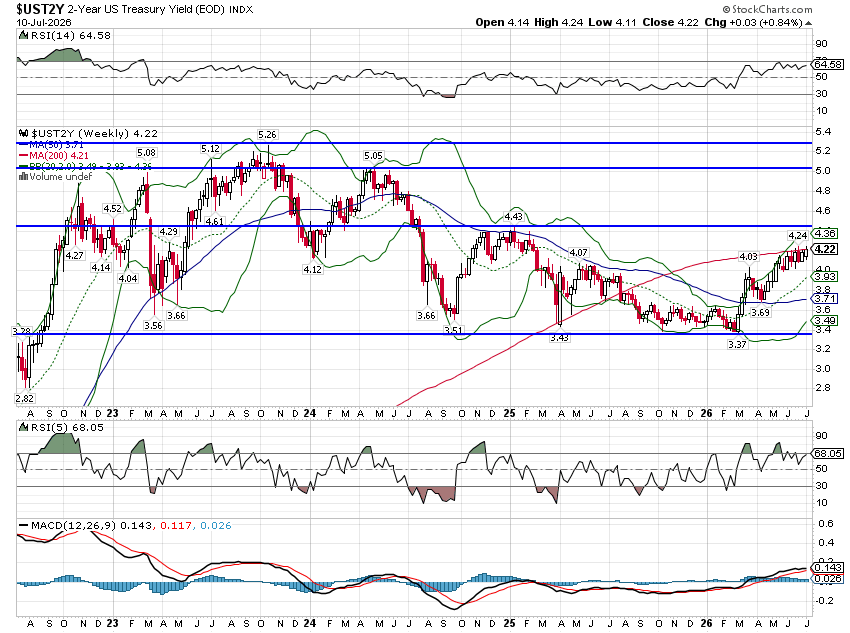
The short term downtrend in the 10 year Treasury yield accelerated last week. Interest rates were down across the curve but more so on the short end so the yield curve continued its steepening trend although the 10 year/2 year spread remains negative by 10 basis points. That is the narrowest spread since mid-2022. This type of steepening in the past, has signaled that recession is near. How near? Well that depends on if the curve normalizes and stays that way until recession or whether it subsequently re-inverts. In the last 4 recession, the average time from the first normalization to the official start of the recession is 18 months but from the last normalization to recession is just 4.5 months. The return of the S&P 500 from the first normalization to recession is 11.9% while the average return from the last normalization is 2.2%.

The curve hasn’t even normalized yet so the clock isn’t even ticking and there is the possibility that the curve normalizes without a recession. There is no rule that says the economy must enter recession after an inversion. Contrary to popular belief the inversion and normalization of the yield curve does not provide a market signal for investors. The only thing the yield curve is guaranteed to do is induce fear when it inverts and more fear when it normalizes and even that is a relatively new phenomenon. I’m not sure exactly when knowledge of the yield curve’s past accuracy in predicting recession became widespread but Campbell Harvey’s dissertation on the subject – the first to recognize the term structure as important – wasn’t published until 1986. It certainly wasn’t well known in the 1990s and probably not even in the early part of this century. At best it is only the last two recession when most investors were aware of the yield curve. The only thing I can say for sure about the yield curve is that once its history became common knowledge, its effectiveness as an indicator changed. Why? Because knowledge of the indicator changes investor behavior which changes markets which in turn affects the yield curve.
So what do we really know? We know that interest rates are in a short term downtrend and have been since last October. We also know that the 10 year yield is unchanged over the last 21 months. We also know that a falling 10 year yield means that expectations for NGDP growth are falling. That could be because inflation expectations are falling (and they are, down 45 basis points since October) or because real growth expectations are falling (which they are, down about 70 basis points since October). We also know what assets generally perform well when interest rates are falling. Bonds obviously do well but Dividend growth and High dividend strategies also do well. Healthcare and utilities, traditional defensive sectors, perform better than their long-term average. REITs and high quality stocks also outperform. The poor performers when rates are falling include commodities and gold (surprisingly), materials, technology and energy.
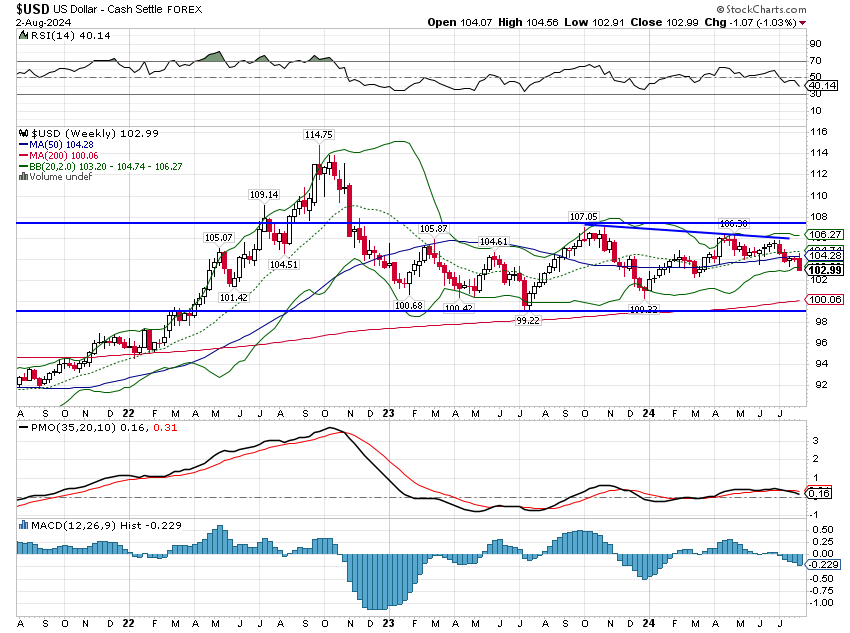
The dollar’s short-term downtrend also accelerated last week but not as much as yields. The dollar was down just over 1% last week and is up less than 1% over the last year. And, like yields, it is still in a trading range, essentially unchanged over the last 20 months.
Markets
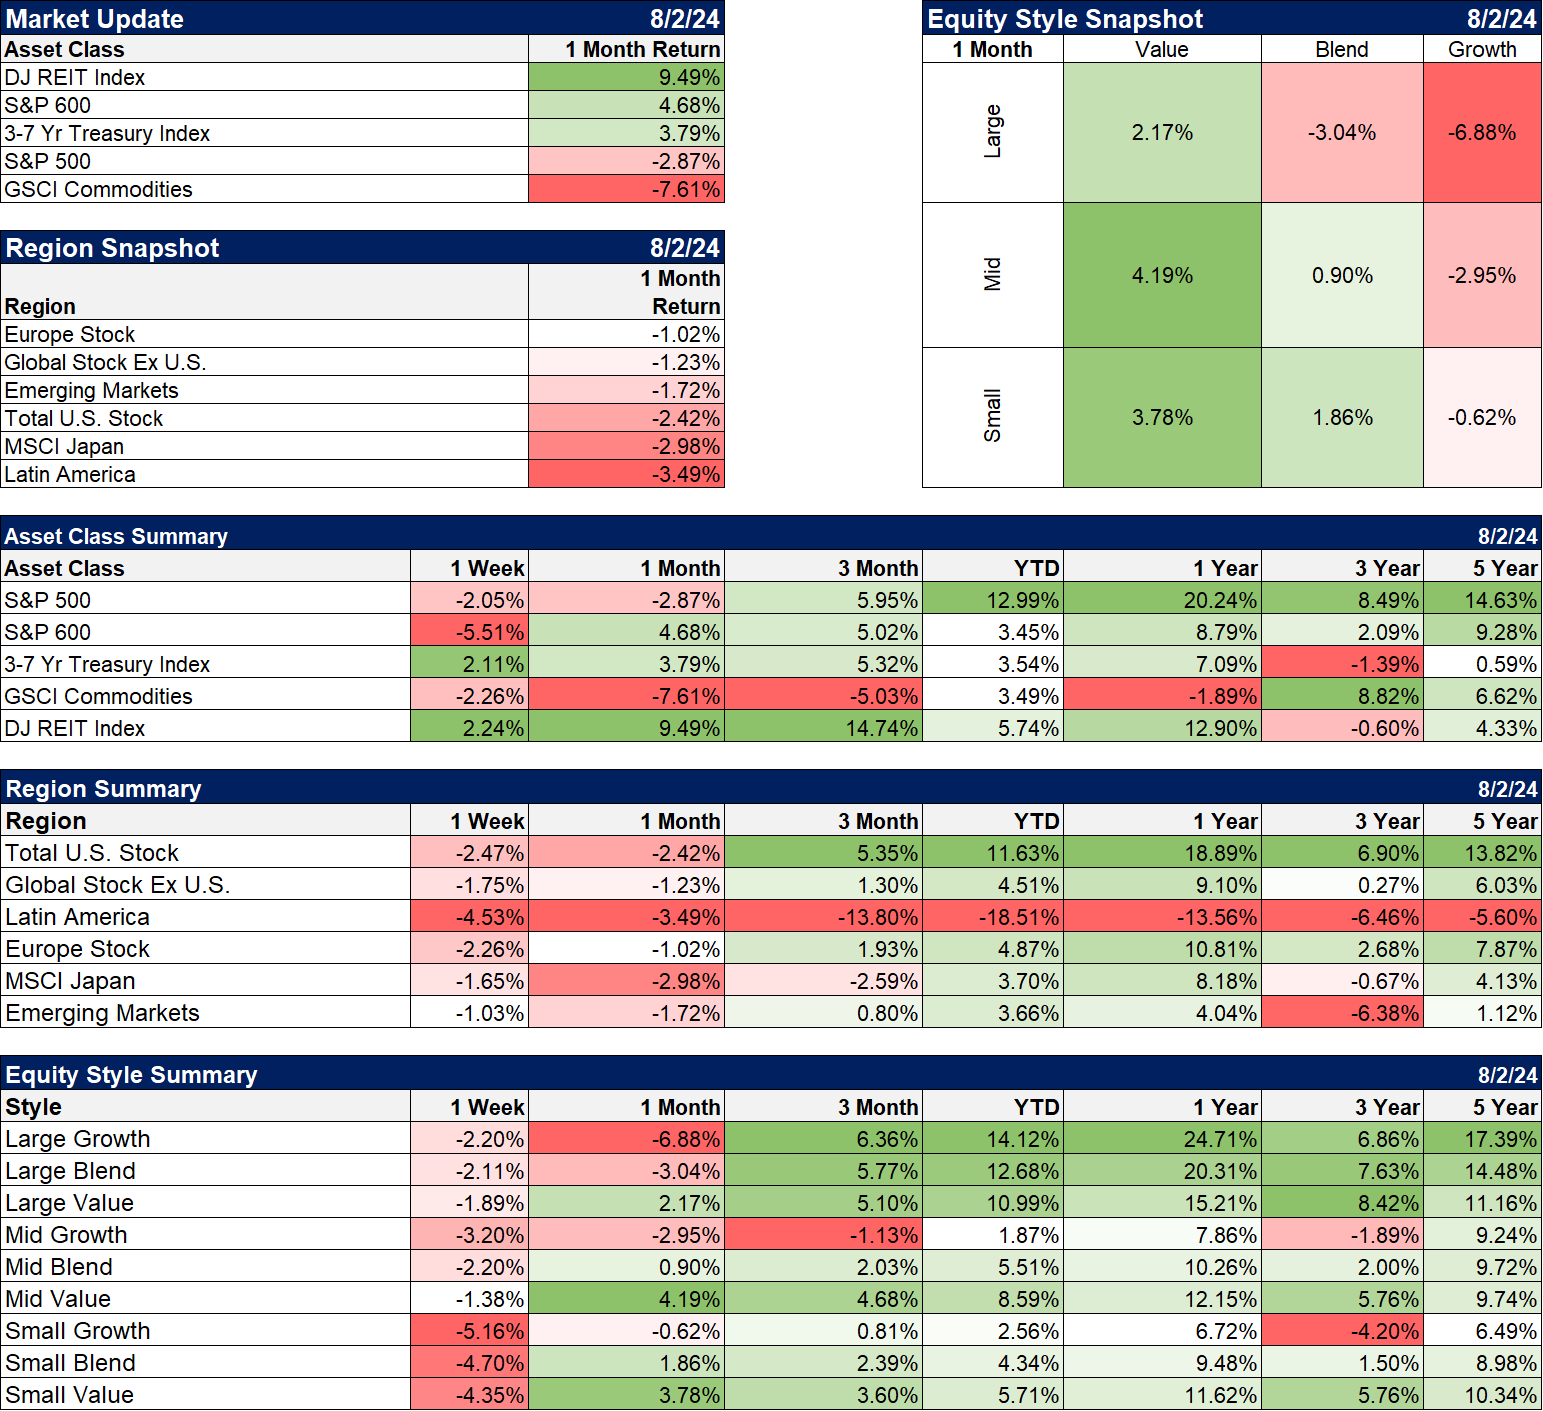
It was a rough week but there were some positives. Lower rates meant a big move in bonds with the intermediate part of the curve up over 2%. REITs continued their win streak, up another 2% last week as well. One of the reasons I would question the recession is nigh urge is that REITs perform well when rates are falling but not in recession. So far, REITs are still responding favorably to lower rates.
The shift to value continued last week even with markets lower. Value fell less than growth and the gap over the last year continues to narrow.
Foreign markets performed even worse than the US last week but a lower dollar will eventually be a positive for non-US markets.
Sectors
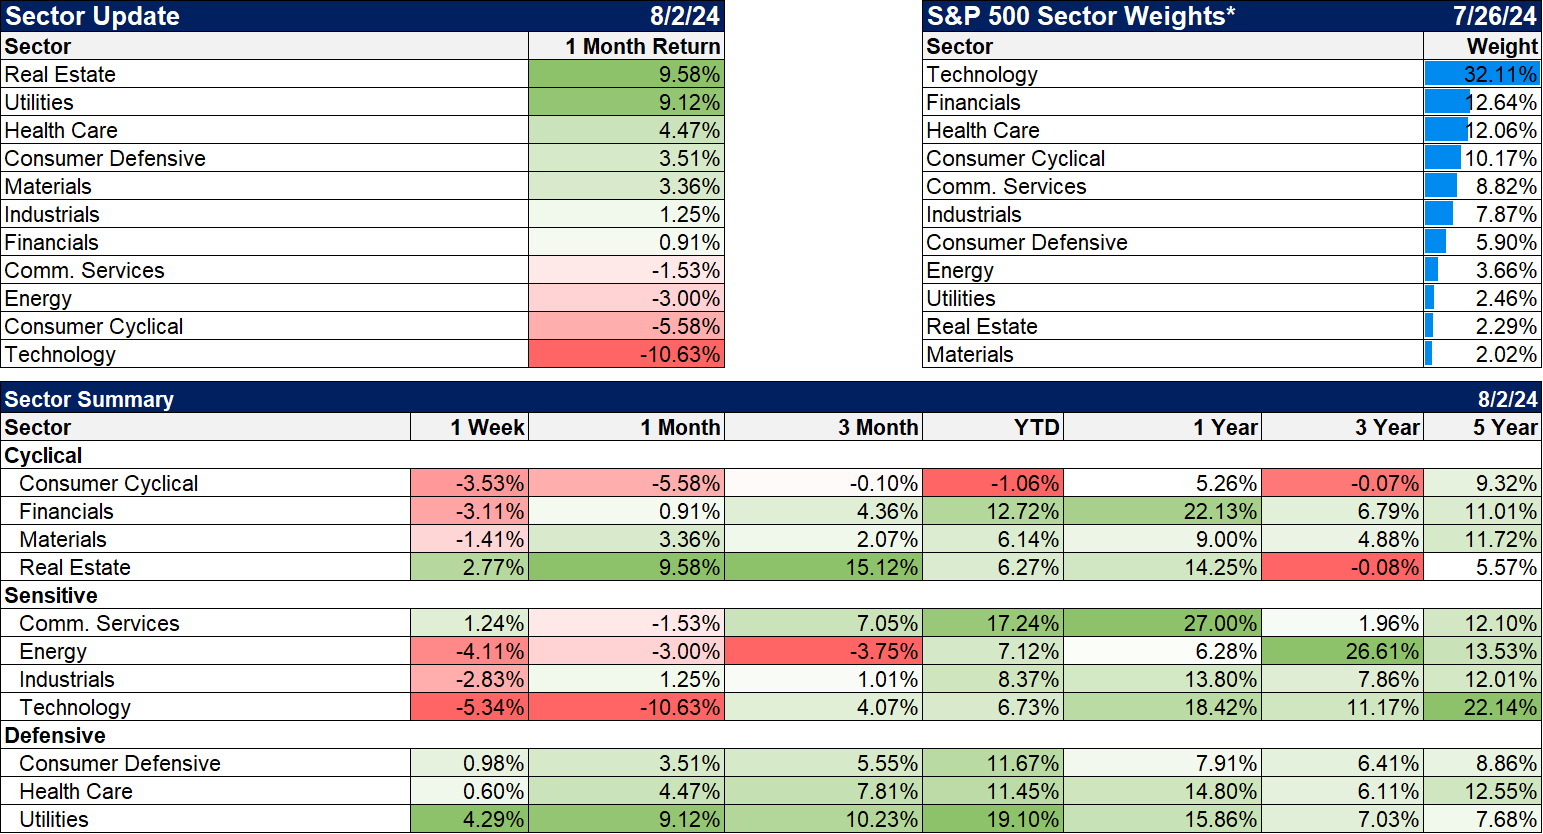
It was a down week but 5 of 11 sectors managed to finish in the black last week. Defensive sectors led mostly but real estate and communication services were higher too. Technology took the biggest hit followed closely by energy. Crude oil was down 3.7%.
Market/Economic Indicators
There were some other economic reports last week as well but nothing that was market moving:
- Dallas Fed Manufacturing index – fell to -17.5 from -15.1 last month. This is mostly about drilling activity but the Texas economy has diversified over the last decade so not only about oil. It has been negative since April of 2022 so no change.
- Case Shiller home prices rose 1% mom and 6.8% yoy in May, down from 1.4% and 7.3% in April. This has been trending down and I expect it to continue.
- JOLTs job openings fell to 8.18 million in June from 8.23 million in May. Still well above pre-COVID levels. The quits rate also fell and is back to pre-COVID norms.
- The employment cost index rose 0.9% down from a 1.2% rise in the first quarter.
- Non-farm productivity rose 2.3% in Q2.
- Construction spending fell 0.3% in June after falling 0.4% in May.
The slowdown in construction makes sense as the factory building boom winds down but investments in equipment – which would seem to be the next logical phase – started to pick up in Q2.
More By This Author:
Recession Signs?Weekly Market Pulse: The Great Rotation
Weekly Market Pulse: Is That Goldilocks I See?


Comments
Log in or sign up to join the conversation.