
“It ain’t what you don’t know that gets you into trouble. It’s what you know for sure that just ain’t so.” – Maybe Mark Twain but could be Josh Billings or someone else entirely

The Great Rotation from large cap stocks to small cap and value stocks that started a few weeks ago, continued unabated last week. There’s a lot of skepticism out there as to whether this can continue, from Wall Street pros to the amateur pundits who dominate places like Redditt and Twitter (I refuse to call it X), but the market doesn’t seem to care; small cap and value stocks have trounced large cap stocks (growth in particular) over the last month. The more interesting question is whether this narrative makes any sense at all. What if the “great” rotation is merely correcting a short-term phenomenon that is only a year old and that prior to that period, there was no need for a great rotation?
The narrative since the aftermath of the 2008 crisis has been that the S&P 500 was the winner you had to own, that owning anything else was a mistake. But is that true or is it just the story Wall Street wants to tell? What would you say if I told you that from the bottom of the 2008/9 bear market to the top just before COVID, small cap stocks outperformed the S&P 500? What would you say if I told you the best performing asset during that period wasn’t large or small cap stocks? What would you say if I told you all of those things are also true from the COVID bottom to the beginning of this year? What would you think if I told you that the outperformance of the S&P 500 is actually just a short term, recent phenomenon that started in 2023 and that this great rotation is nothing more than markets returning to normal as the AI hype fades? Well, all of that is true so if you been having a lot angst about whether you should own the S&P 500, take a deep breath and relax. You don’t.
From the financial crisis bottom on February 9th, 2009 to the bull market top on February 19th, 2020 the S&P 600 and the CRSP small cap indexes both outperformed the S&P 500. What didn’t outperform was the Russell 2000 index of small stocks that most people take as the benchmark. But why is that the benchmark? No good reason I know of and when you look at it, one wonders why exactly it should be. Roughly 40% of the Russell index is unprofitable junk that will never be profitable. The median market cap is just $900 million and the smallest company has a market cap of just $10.8 million (PRST). The stocks in the index run from microcap junk to midcaps; the biggest holding has a market cap of $12 billion.
And, as I mentioned above, small and large cap stocks were not even the best performing major asset during that time frame. That was the DJ REIT index which outperformed the S&P 500 by 85 basis points a year over that period.
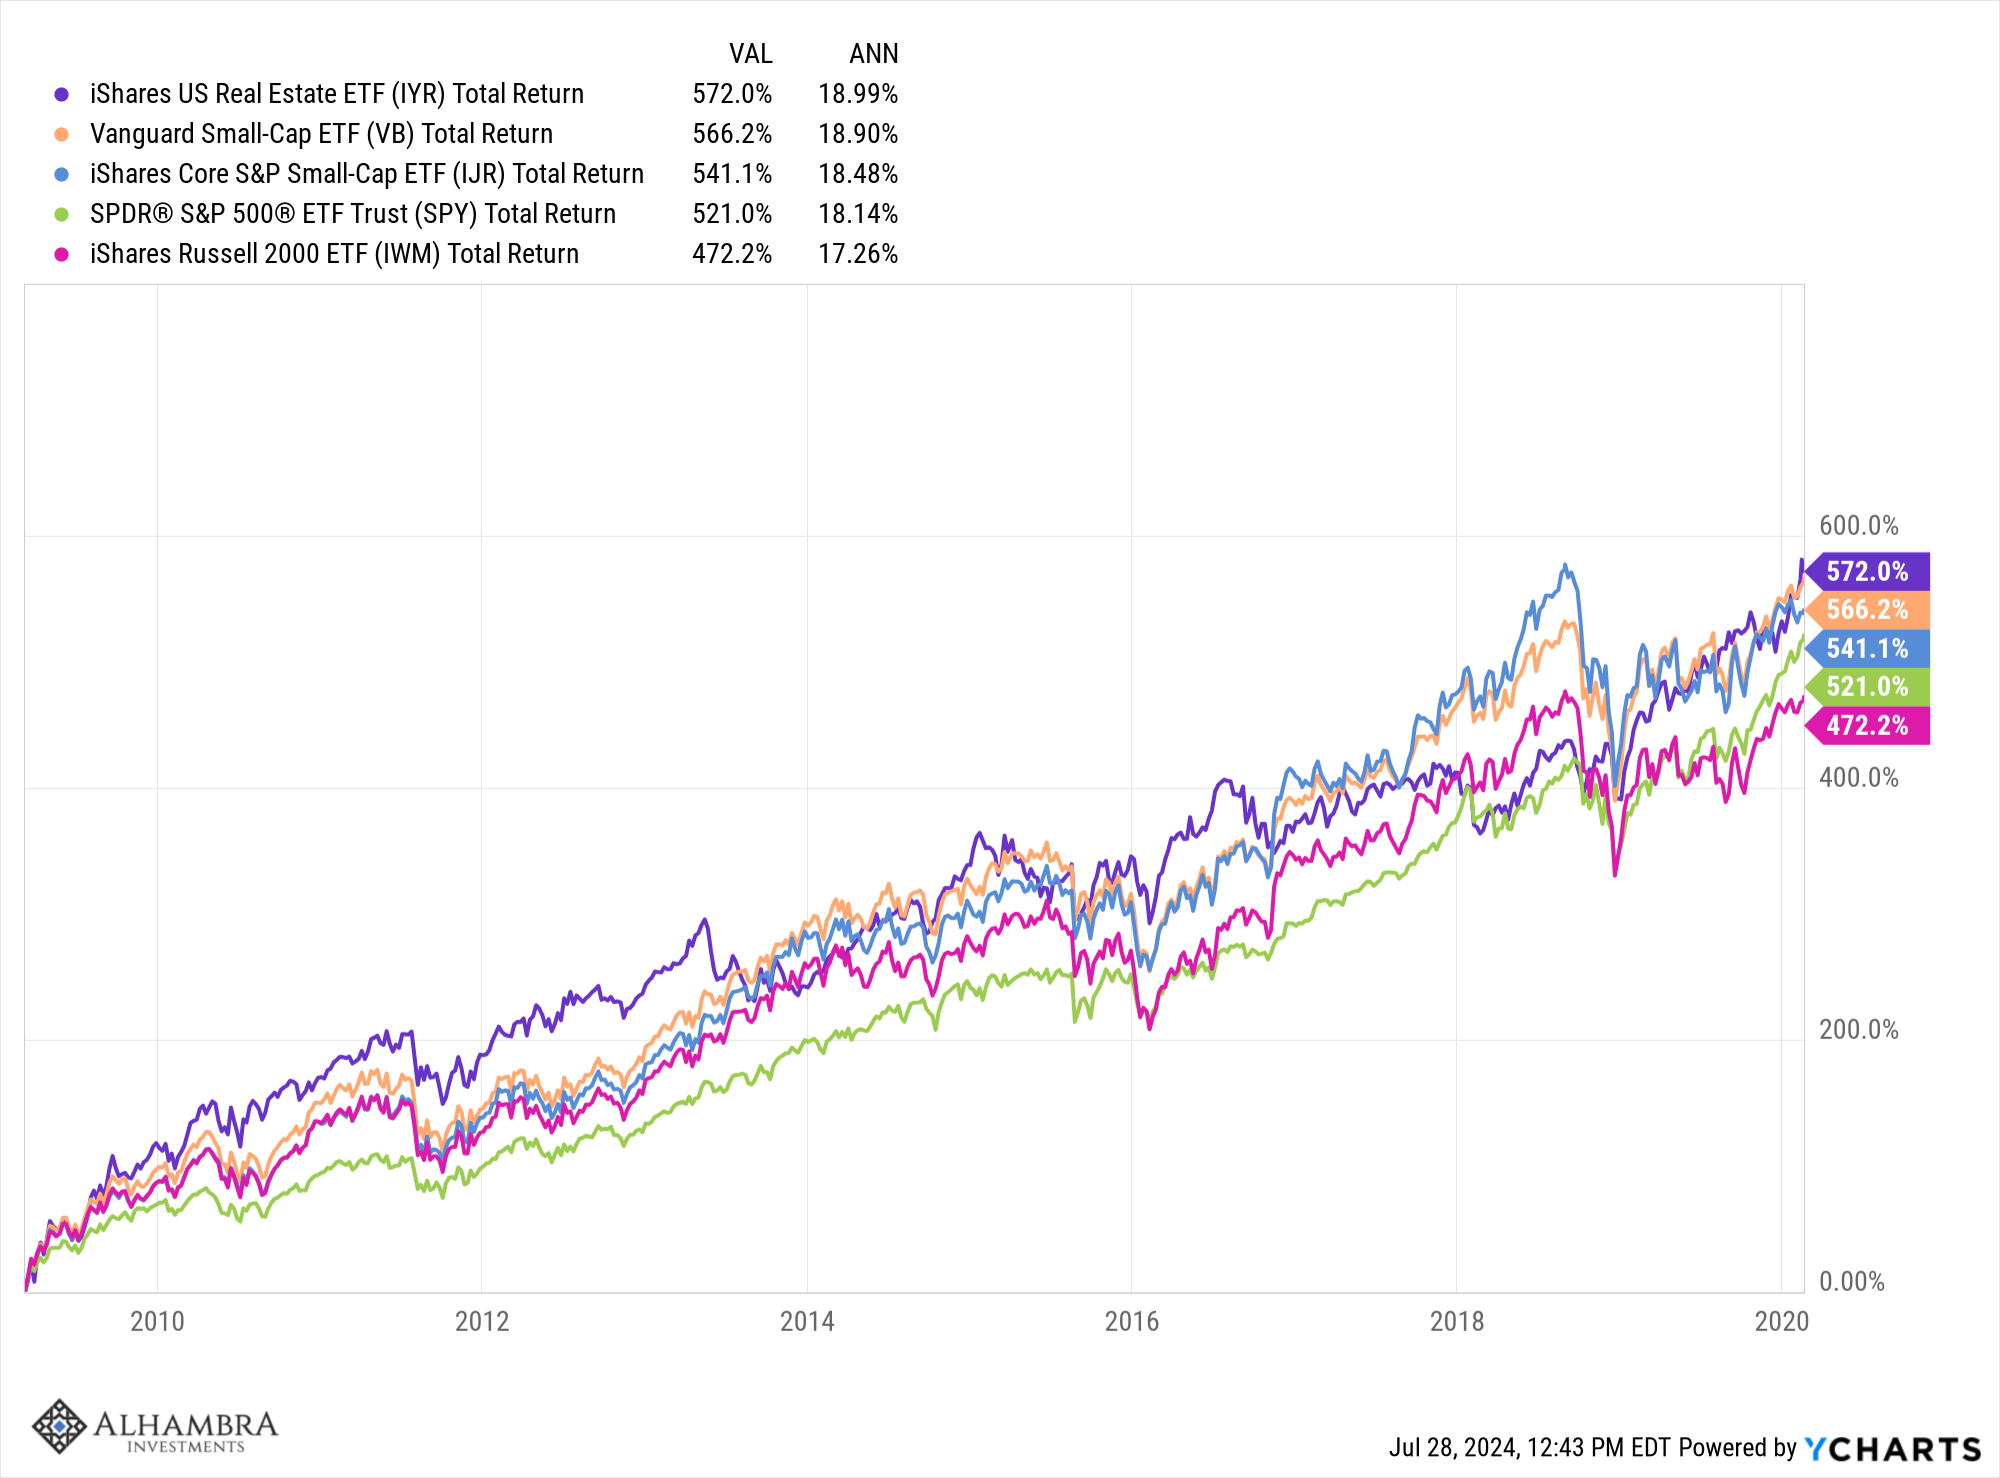
When Wall Street says that small cap stocks have underperformed what they really mean is that the smallest, junkiest US stocks that trade publicly have underperformed. I don’t know about you but I am not exactly shocked by that. The S&P 600 and the CRSP small cap indexes both have financial viability screens which require that companies in the index be profitable; the Russell 2000 does not. There are differences between the S&P 600 and the CRSP index; the CRSP index has more than double the number of stocks of the S&P 600. But either of them are a major step up in quality from the R2000. There are times, I suppose, when it might make sense to own the junkier index, but if you want to stick to high quality merchandise (and we do) you should probably just remove the R2000 from your list of potential investments.
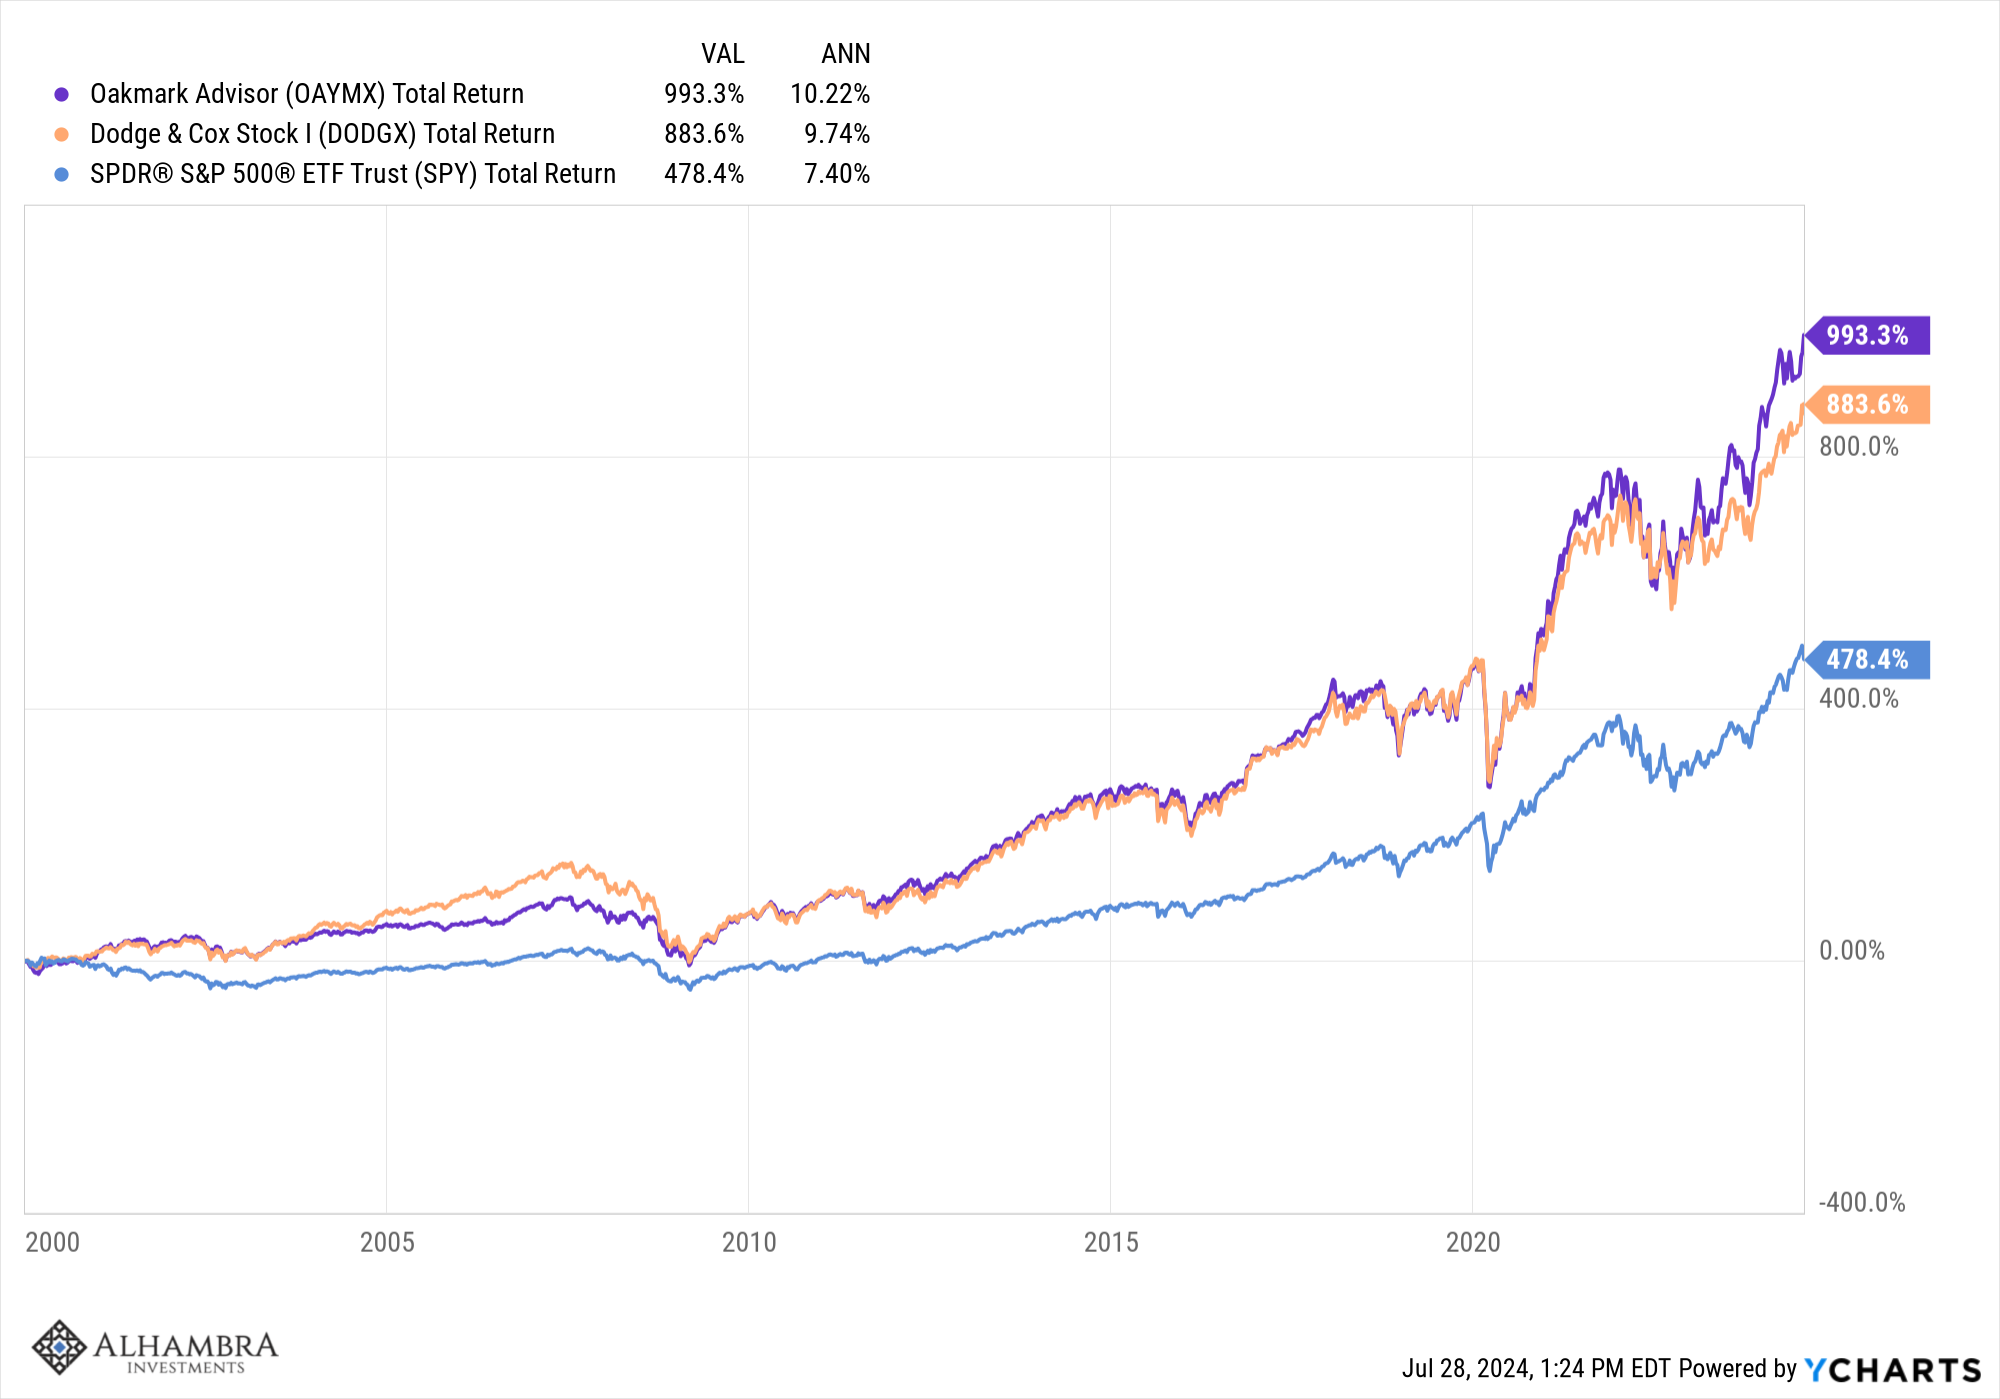
Value stocks haven’t performed as poorly as advertised either unless you think your only option for large cap value is the S&P 500 value index. It is another index that is, in my opinion, poorly constructed and not representative of what value investors look for. There are some large cap value funds out there that have consistently outperformed the S&P 500 over long periods of time. We have, over the years, used two: Dodge & Cox Stock (DODGX) and Oakmark (OAYMX) both of which we own currently in our client accounts (although we have mostly shifted to Oakmark in recent years). Both of those funds have outperformed the S&P 500 by a wide margin this century.
What’s really going on right now is that the market is correcting some of the AI hype and the bank crisis fears of the last year. Small, midcap and value stocks started to underperform when the mini banking crisis hit last spring. It was also around that time that AI stocks started to get noticed although it wasn’t until this year they really took off. Now it seems that maybe the mini banking panic and the promise of AI were both overblown. Since the week Silicon Valley Bank failed, regional bank shares are up less than 5% total, but since the week after SVB’s failure, they have outperformed the S&P 500. They have continued to catch up during this rotation, up over 20% just since July 1st.
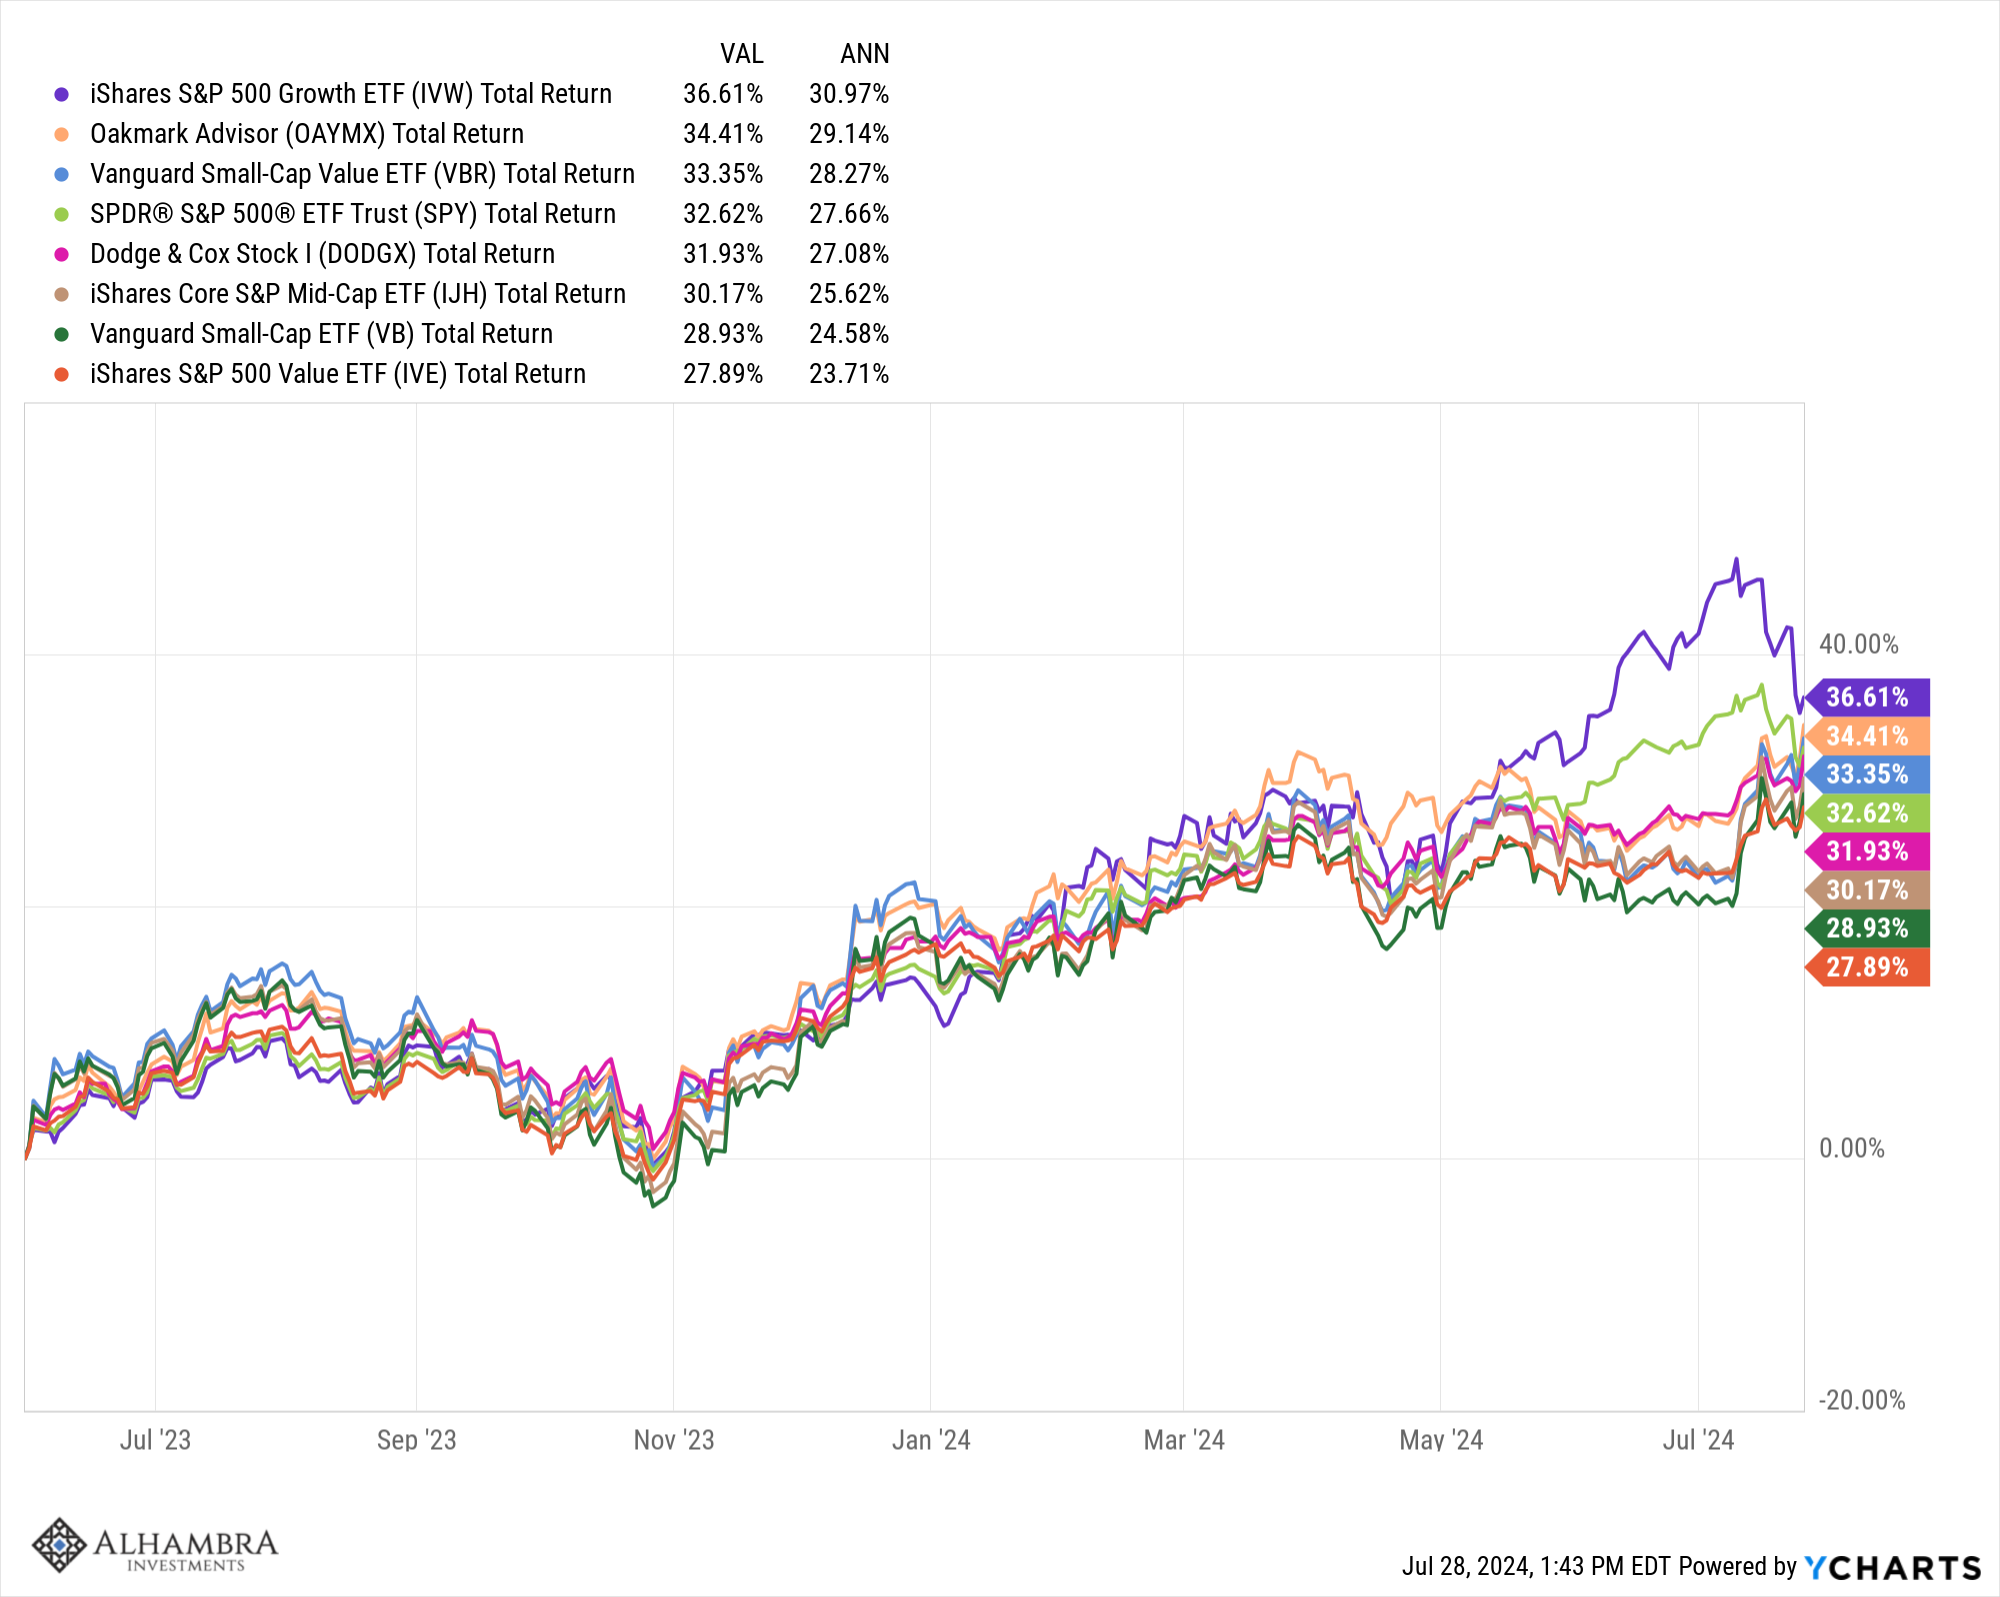
The post COVID period has been similar with Large cap value, small caps and midcaps all keeping pace with or beating the S&P 500 through May of last year. Since the end of May last year, the real rotation was into the S&P 500 as it played catch up with the other parts of the market. The outperformance of large cap growth from the end of May last year until July 10th this year was impressive but in just two weeks, the gap has been closed considerably. And the gap wasn’t closed merely because small and mid cap stocks started going up; it was closed because large cap growth stocks came back to earth. The S&P 500 growth index is down 7.4% over the last two weeks while all the others have risen. That’s the kind of rapid downdraft you should expect in highly valued stocks and it’s why we’ve been avoiding the S&P 500. And no, this isn’t enough of a correction to get me interested in buying it.
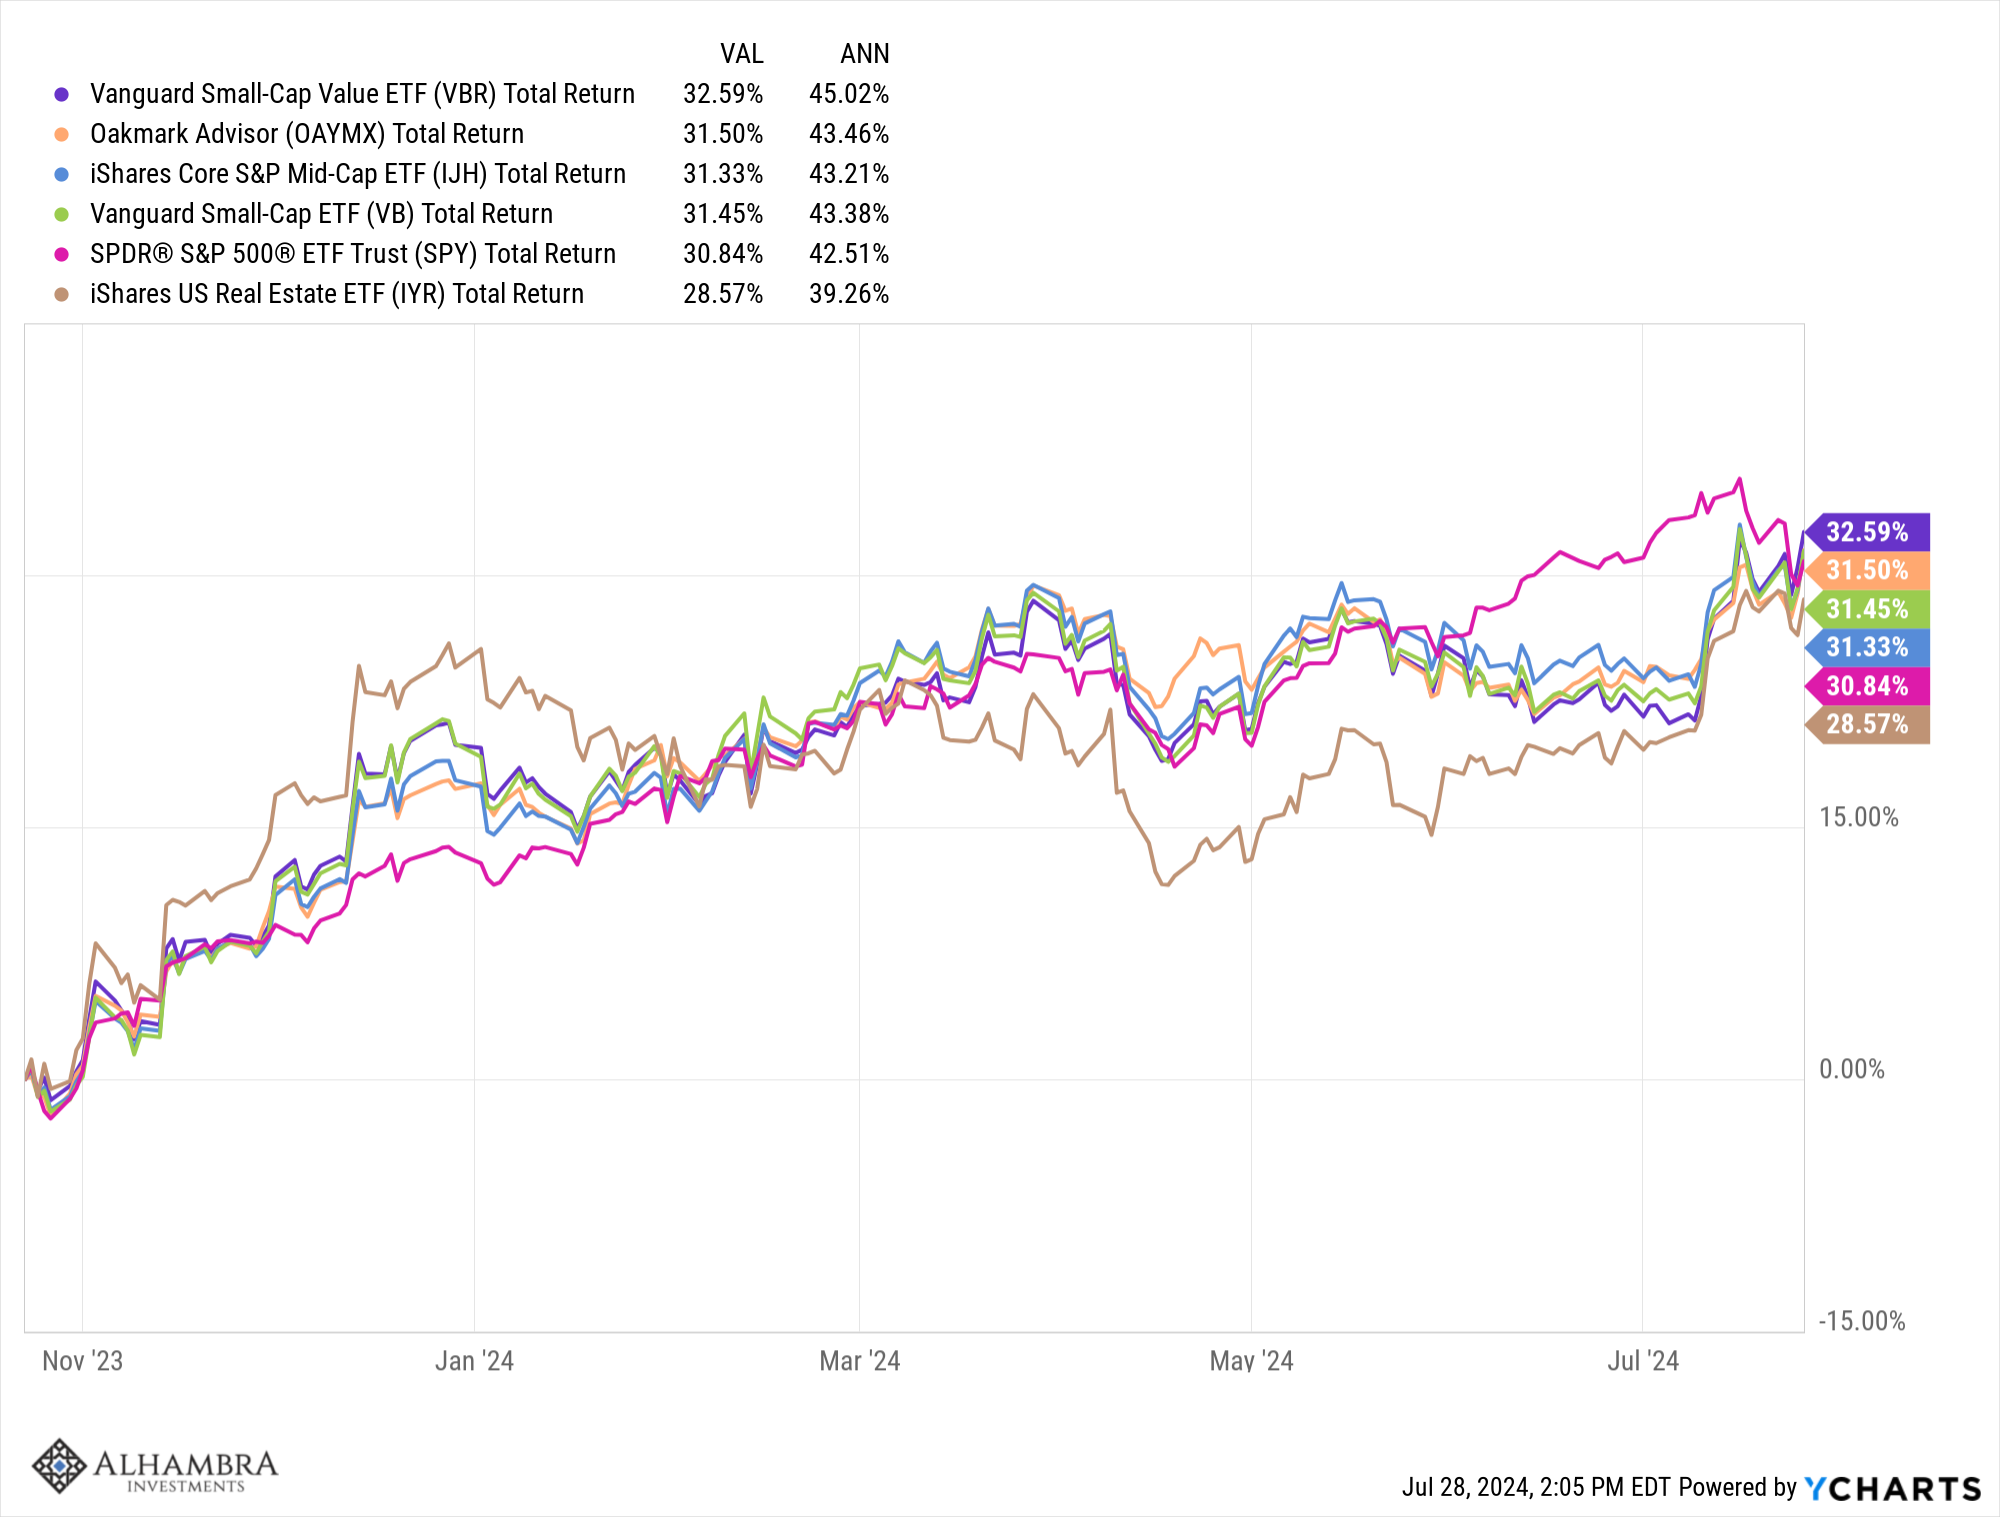
REITs have also started to perform better, primarily due to rising expectations for Fed rate cuts. REITs performed very poorly during the Fed rate hiking cycle, down 9% since the spring of 2022 while stocks are higher during that time. But since rates peaked late last year and the Fed signaled they expect their next move to be a cut, REITs have performed almost the same as stocks. If rates keep coming down I expect to see REITs recover some or all of the ground they lost to stocks during the rate hiking cycle. Real estate, of all kinds, was the only sector of the economy to really respond to the Fed’s rate hikes and I expect it to recover rapidly if and when rates come down. That may be more true of commercial real estate than residential because a lot of CRE loans are priced as a spread over SOFR (the LIBOR replacement), a short term rate which is directly influenced by the Fed’s actions.
The great rotation is nothing of the sort. It is just markets getting back to normal after a flight of fancy that is not as fancy now as was thought a few weeks ago. These thematic reveries seem to happen more frequently these days but most of them are chimeras, forgotten as soon as something newer and shinier comes along. Investing isn’t about rushing to get in on the next big thing. It’s about buying the things that are out of favor today, unloved stocks and markets that are cheap now with the potential to be more dear in the future. Just be aware that the future may not arrive in all parts of your portfolio at the same time. If you aren’t mad about at least one part of your portfolio all the time you aren’t properly diversified.
The world isn’t always as it is portrayed. There is no great rotation that just started a couple of weeks ago. Take a look at the chart below and you’ll find that large and small cap value stocks have outperformed large cap growth stocks over the last three years. Mid and small cap value stocks have outperformed mid and small cap growth stocks over the last 5 years as well. That isn’t what most people believe but it is true. The outperformance of value stocks is not an emerging trend. It has already emerged and so has the trend toward smaller companies. The last year was the anomaly, not the last two weeks.
Joe Calhoun
Environment

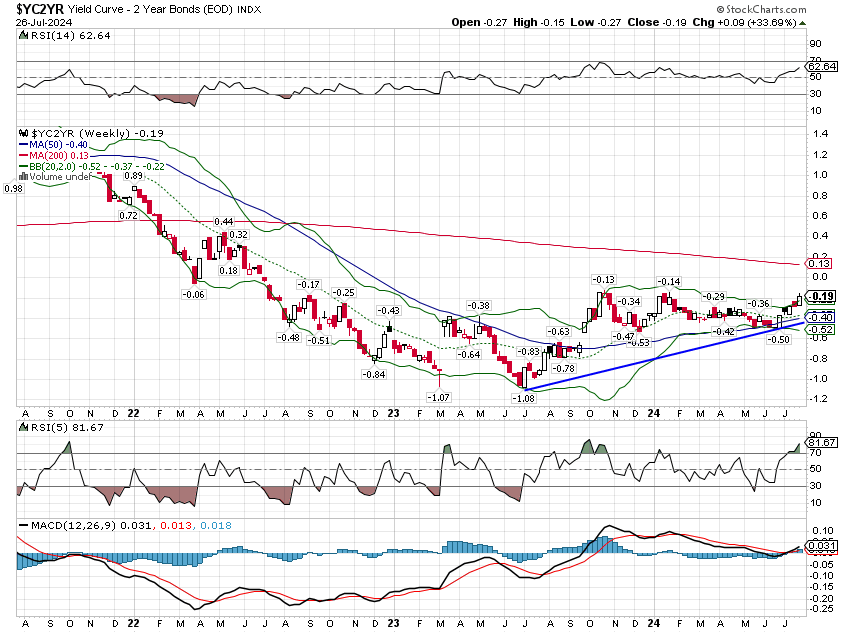
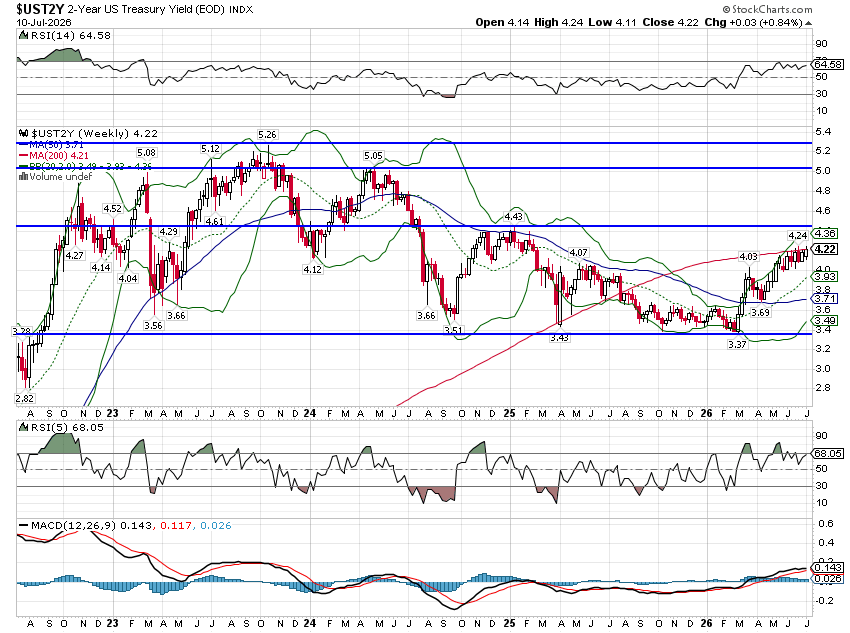
The 10 year Treasury rate fell 4 basis points last week and the dollar was unchanged. It probably goes without saying that no trends changed last week. The only thing really worth mentioning is that the yield curve is moving toward normalization (uninverted). In the past, that has been a precursor to recession so we’ll be watching it. But right now, futures markets are not pricing in much change in the 10 year rate over the next year. In other words, the market is pricing in a drop in short term rates but not long term; a soft landing. We’ll see.
Markets
The small/mid/value surge is mostly confined to the US. The correlation between foreign and US stock indexes has risen in recent years and now stands around 0.7; you don’t get as much diversification benefit as you once did for investing internationally. I think that would change if the dollar gets into a downtrend but we aren’t there yet.
Commodities have also been weak the last month. Most of that appears to be due to copper and to a lesser degree crude oil. Copper was deemed an AI play and soared right along with NVDA, up over 40% from February to May. It’s down 26% since peaking and almost back to where it started.
Japan has been weak recently as the Yen has rallied off its lows. The weak Yen was part of the reason for the rally in Japan so it will correct as the Yen does. But the reforms in Japan are not just about the Yen and so this is likely just a correction. There is probably nothing that could be better for Japan than if the Yen just stabilized for a while.

Sectors
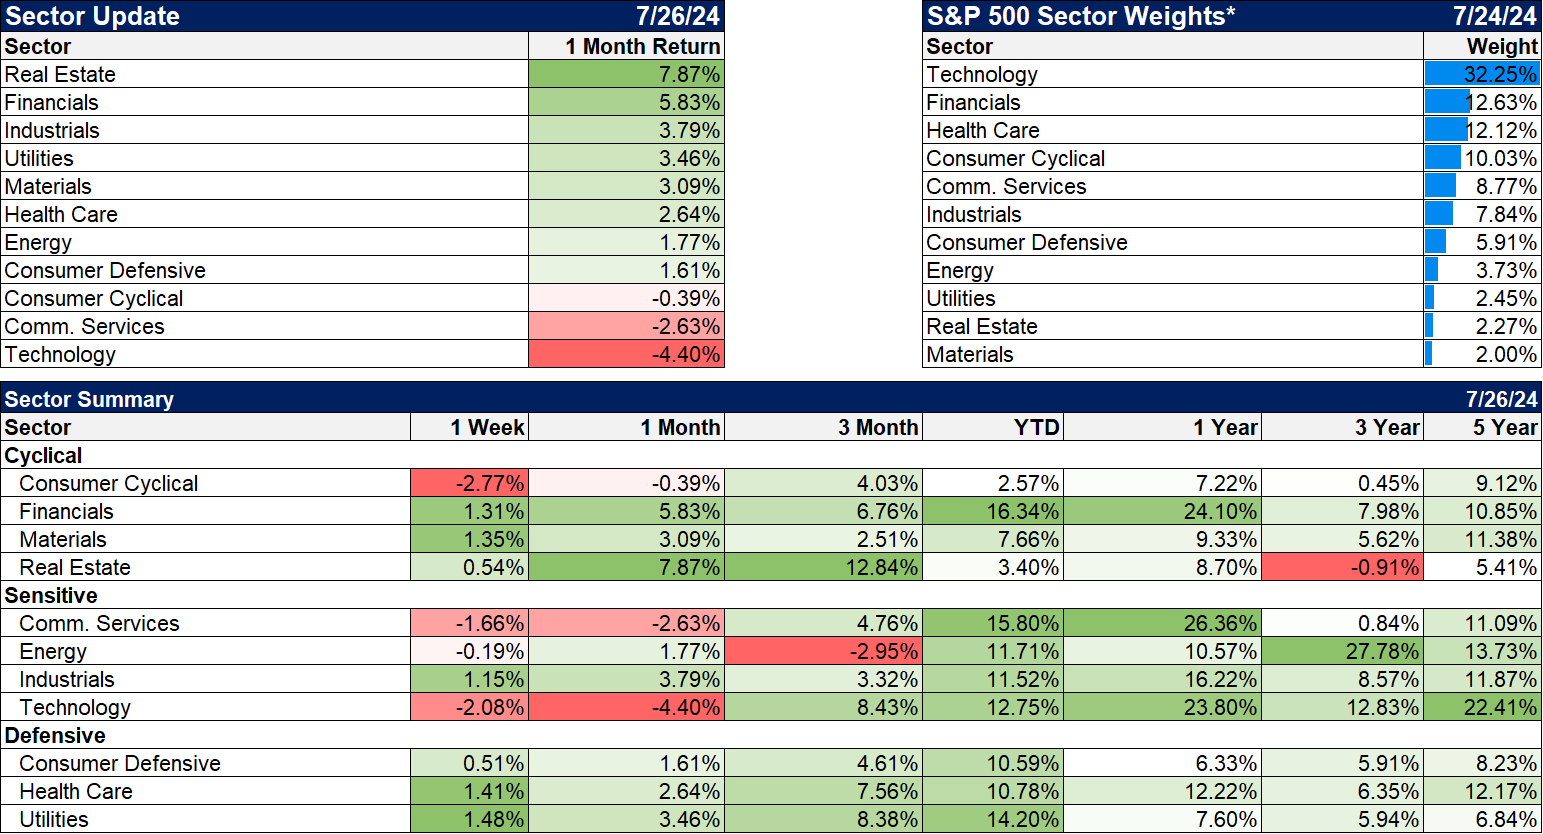
My how things have changed in such a short time. Technology and Comm. Services move from top to bottom and REITs move from bottom to top. YTD, Financials are leading with Comm. Services and Utilities close behind. A very odd group that doesn’t usually move together but the first two are the only sectors to outperform the index this year and the third is just out of the money.
Market/Economic Indicators
I have a review of the GDP report on MyPersonalCFO.com: The Economy Continues To Grow At Trend
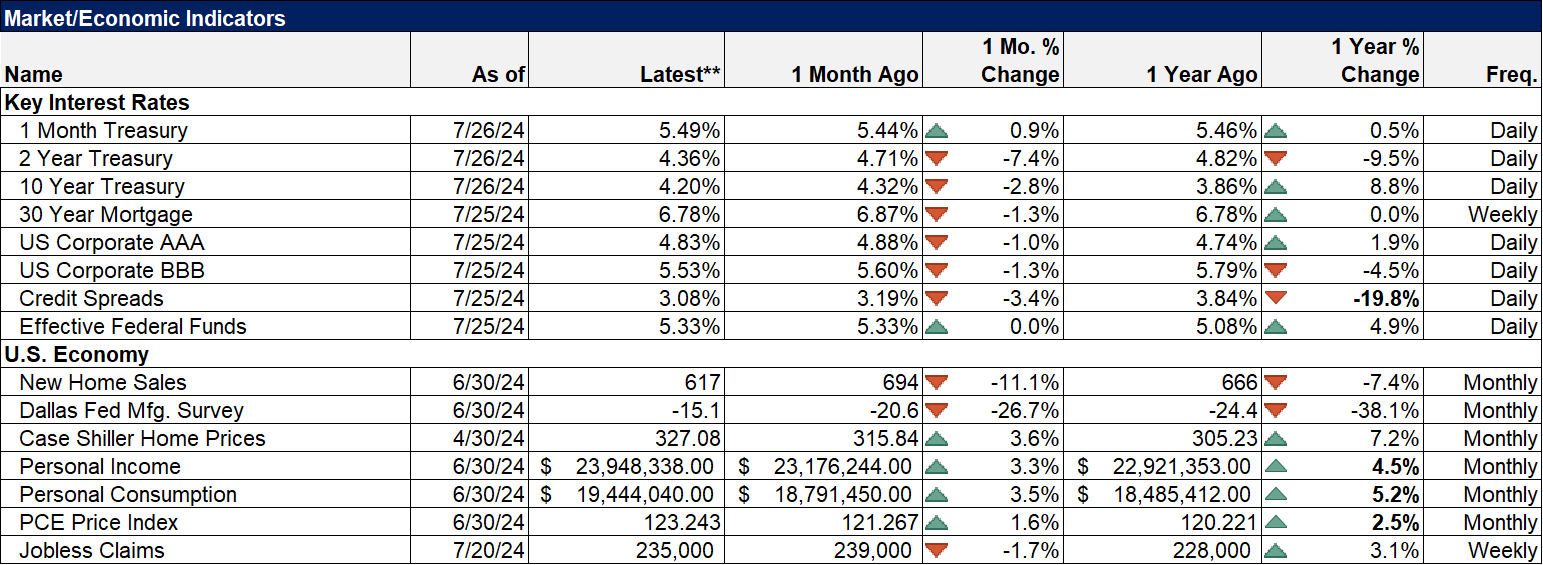
Most of the economic data last week was as expected but one report did get a reaction that deserves mention. The Personal Income and Spending report released on Friday included the Fed’s preferred inflation measure, the PCE price index. The headline reading was up 0.1%, exactly as expected. The core reading (ex-food and energy) though was up 0.2%, a tenth above the expected 0.1%. A worse than expected inflation report a few months ago would have sent the market into a tizzy, bonds and stocks selling off in unison. This time? Nada. Zilch. Well, actually not nothing, but the total opposite of what one would expect. Bonds and stocks rallied together and not a little. The Dow closed up 650 points while the S&P rallied over 1% and the S&P 600 (small caps) up nearly 2%.
Over the years I have learned to pay special attention when markets don’t move as expected. A stock rallying after the release of bad news is usually a sign that the sellers have been exhausted. A stock or market falling on positive news means the buyers are sated. In this case, bad news was shrugged off and buyers stepped in. And sentiment is far from ebullient but not exactly dour either; there’s nothing extreme in those types of indicators. Are investors so anxious to get in the market ahead of a rate cut they are willing to shrug off bad news? Maybe. Or maybe its something else, something that isn’t obvious yet. Whatever the cause, we weren’t lacking for buyers last Friday.
More By This Author:
Weekly Market Pulse: Is That Goldilocks I See?Weekly Market Pulse: The Soft Landing Zone
The Fed Gets Its Wish


Comments
Log in or sign up to join the conversation.