Weekly Market Pulse: Situation Normal
Is this normal? I haven’t made any money in like two years.
Question from a recent acquaintance upon hearing what I do for a living
Unsplash
Let’s get this out of the way quickly. The answer to his question is yes, this is painfully normal. When you have a bear market – or you have two in four years like we have recently – the recovery time is never quick enough, especially if you are retired – as he is – and not continuing to add to your portfolio. For someone still in the accumulation phase of life, bear markets are a painful gift that allows you to make new investments at cheaper prices. But for the retiree, especially one drawing a regular income from his portfolio, bear markets are the curse that keeps you cursing.
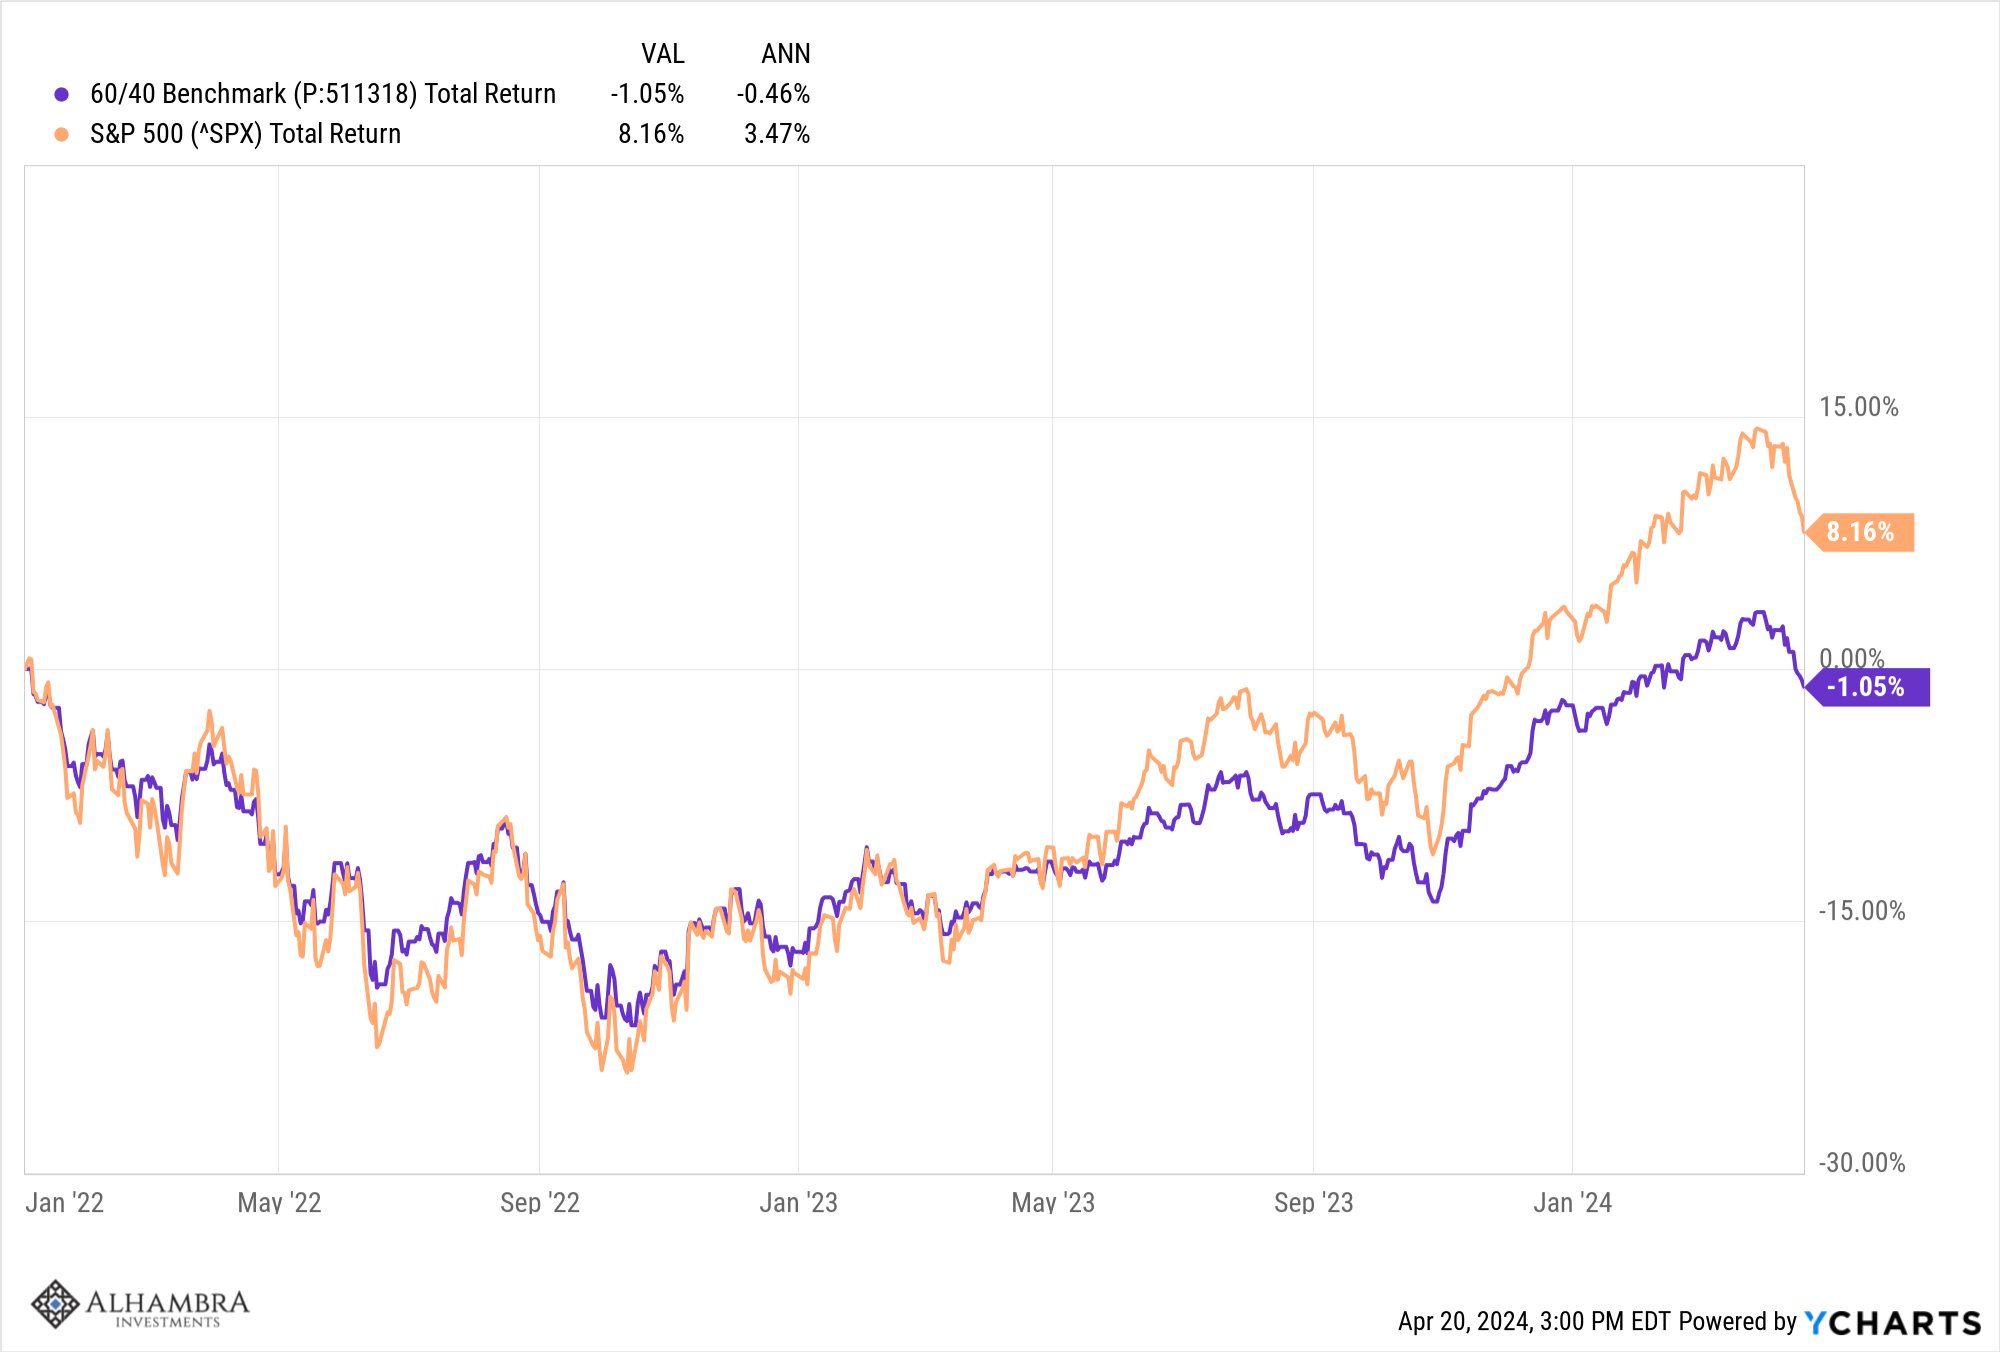
My new friend’s timeline is quite correct. If we measure from the peak of the post-COVID bull (January 3rd, 2022) to today, the return of a 60/40 stock/bond portfolio is actually slightly negative (-1.05% total or -0.46% annualized). The S&P 500 is up a mere 8.2% total (3.47% annualized). That is 2 1/4 years with basically no return and with a nearly 6% slide in the stock market in the first three trading weeks of the new quarter, it feels like things are just going right back down again. Even the reason for the recent decline is the same – rising interest rates – although the recent rise has yet to break above last October’s peak.
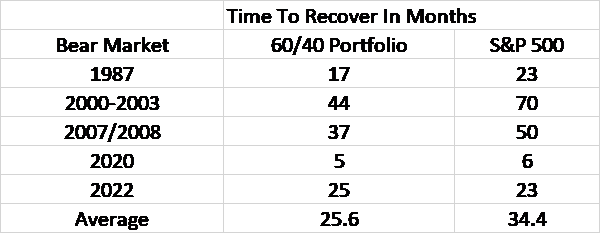
Is two years a long time? It sure seems that way but in market terms it isn’t really. In fact, this two year stretch looks just about average based on the last five bear markets.
The question that comes to mind with every bear market is whether there was some way to avoid it and get a better result. The answer, unfortunately, is no. We run portfolios that are more diversified than the standard 60/40 portfolio and we get a smoother ride – less volatility – but we generally end up in about the same place. Or, historically, if we seek to match volatility we get a higher return; that’s how diversification done right works. Now, we think the smoother ride is valuable because it will, hopefully, allow you to stick to the strategy rather than bail out at the bottom. That is the value of having a better, more diversified strategy and a good investment adviser – you’ll stay in for the recovery rather than turning a temporary loss into a permanent one.
I have been doing this for over 30 years now and I would love to tell you that all that experience allows me to avoid bear markets and fully embrace bulls. But I’m not going to do that because it would be a lie. I have looked at every imaginable market timing method, every macro based system, every trading tactic and there isn’t one that is repeatable and reliable enough to allow you to get a better result than just riding out the bear phases with a good strategy. There are tactical changes you can make to your portfolio that will make a difference in your long term returns, but they are all subjective and rely on historical precedent that may or may not repeat. That’s why tactical changes have to be incremental since the one thing you want to avoid is a big mistake. You want to target tactical changes that have a large potential payoff so you can have an impact on your portfolio without wholesale changes. We know, for instance, that the average return in International Developed market stocks is 5.1% in years when the dollar rises and 17.9% in years when the dollar falls. If you get the direction of the dollar right you don’t have to have a lot of international stocks in your portfolio to impact the total return of your portfolio. And if your initial tactical shift to international is small, the damage if you’re wrong won’t be that great.
Today, investors face a unique set of circumstances. This economic cycle is obviously different than others of recent vintage because of the changes wrought by COVID and the response to it. But is it so different that a change in investment strategy is required? The post-COVID economy is definitely different than the one that prevailed in the period from the 2008 crisis to the pandemic. But is it sufficiently different that strategies that have worked for decades need to be abandoned in favor of…what? There are only so many ways to put together a strategic portfolio, there are only so many assets that can be included or excluded although there are a near infinite weighting schemes (60/40, 60/30/10, 43.5/16.5/10/5/5/20?). Even if you think a strategic (near permanent rather than temporary like a tactical change) change is necessary, what would it involve?
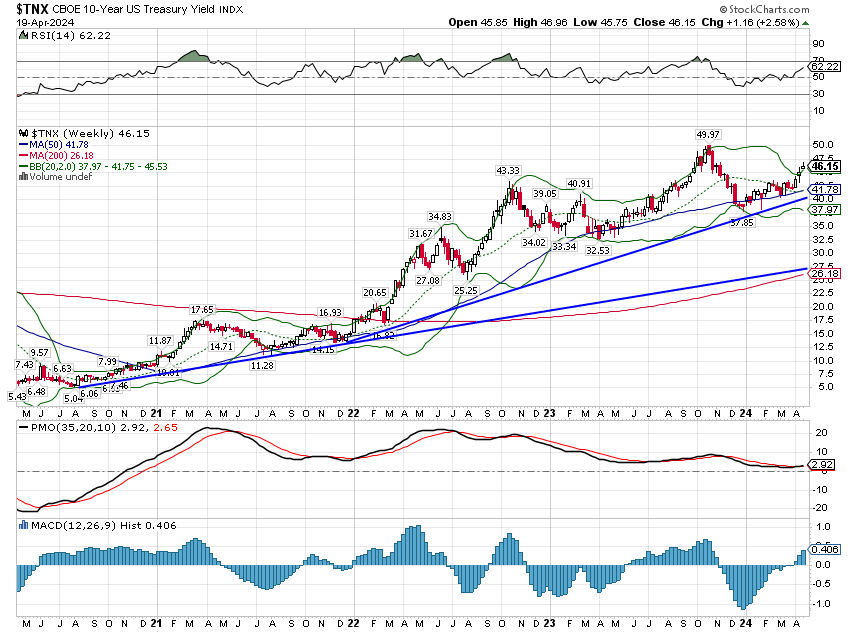
What this really boils down to I think is what you think of the driver of this bear market – inflation and interest rates. Many of the strategic models being used in investing today were built from economic and market data that included one very large trend. The 10 year Treasury yield peaked in 1981 at over 15% and it fell, relentlessly, for the next 39 years until it hit 0.4% in 2020. That downtrend was a secular trend that lasted decades and was only interrupted on a cyclical basis with uptrends in 1983, 1987, 1994, 1999, 2003-07, 2009, 2013, 2017-18. All of those were temporary and rates continued to fall to new lows in each subsequent business cycle over that 4 decade period. If you used data that covered only that period from 1981 to 2020 to build a model, it may be biased to falling rates.
The 10 year yield has been rising now for four years and all the things that don’t normally do that well in a rising rate environment have suffered. The most obvious example is bonds which most everyone has in their portfolio. Like most investors, we addressed rising rates on a tactical basis by reducing the duration of our portfolio. And we are still today at a duration that is less than what is called for in our strategic model. Another obvious example is REITs (real estate) and since we have a generous allocation to them I can attest personally that they have performed poorly. Even so, our model has produced a result that is exactly what we expected, a return similar to that of a stock/bond portfolio but with lower volatility (risk). I can’t help but think though, with the benefit of hindsight, that we could have done better if we had a strategic model that allocated less to real estate.
Just to review, strategic is your long term plan to achieve your goals, while tactical is how you implement the strategy and when/how you might deviate from it. A tactical decision would involve choosing, for instance, international or domestic stocks, long or short term bonds, etc. A strategic decision would involve determining what percentage of your portfolio will be invested in stocks or bonds or gold or bonds over the long term, a target allocation for each asset class. Tactical changes are generally short term while strategic decisions are long term, more permanent.
It is a particularly tricky time to be making a decision about strategic versus tactical changes. Interest rates have been rising for 4 years but we don’t know if they will now be in a secular rising trend or if this is temporary like past rises. The 4 year period isn’t unprecedented in the long secular downtrend period; the last similar stretch was 2003-2007. Even if it is a secular, long term, change in trend, there will be periods of falling rates just as there were periods of rising rates during ’81-’20 period. If the economy is near recession – I have nothing to indicate that it is but let’s just assume – then rates would be expected to peak and fall as the economy slows. How low might rates fall? On a purely technical basis, I could easily see the 10 year rate fall to the 2.5 – 3.0% range, a significant drop from the current 4.6%, and still be in an uptrend from the 2020 low. If you make a strategic change now to reduce the interest rate sensitivity of your portfolio, you won’t benefit as much during the periods when rates are falling.
I built our strategic model on data back to 1972 so it includes the end of the last rising interest rate period. I chose 1972 because for some of the asset classes we use that was as far back as the data was available. I also chose it because it was the beginning of the post Bretton Woods era, the change to a floating exchange rate system. And the model performed quite well during that rising rate period of the 1970s so I feel confident it can withstand higher rates. But if rates rise for years – decades – rather than months, the interest rate sensitive portions of our portfolio will chronically underperform and hurt our long term performance. So, is it time, 24 years after I devised this strategic allocation, to make a more than tactical change?
As with most things in investing – and life – the answer is to move incrementally. A tactical change made today because of rising interest rates, a move that is incremental to reduce the interest rate sensitivity of your portfolio, could turn into something larger and more permanent down the road. There is no reason you have to make that decision today when we have no idea if inflation will continue to bedevil the economy as it did in the 1970s and keep interest rates on a rising path. All we know today is that interest rates are still rising right now. That might continue for years or it might be over in a matter of months.
I believe a strategy, a strategic asset allocation plan, is absolutely necessary for financial success. You shouldn’t be trying to adjust your asset allocation based on every little twitch in the markets, which is what usually happens if you don’t have the anchor of a strategic allocation. Adjustments based on market conditions should be systematic and usually short term – tactical in nature. But short term can last for years because the trends that drive tactical changes can last for years. The dollar rose from 1995 to 2001, a trend that was unfavorable to gold, commodities and international stocks. The dollar fell from 2001 to 2008, a trend that favored gold, commodities and international stocks. An investor following the trend of the dollar could have made some simple tactical changes in 1995, 2001 and 2008, changes that were roughly 7 years apart, that would have had a big impact on their portfolio returns.
Changes to your strategy should be made with great reluctance. Tactical changes should also not be made lightly and the most successful ones often come years apart. But they do happen and I think there are several underway right now. It has been a frustrating couple of years for investors but it is also an exciting one. Trends that have been in place for years appear to be changing and to me that means opportunity. Concentrate on what could make a big difference in your portfolio over the next five or ten years, not what might make you feel better right now.
Environment
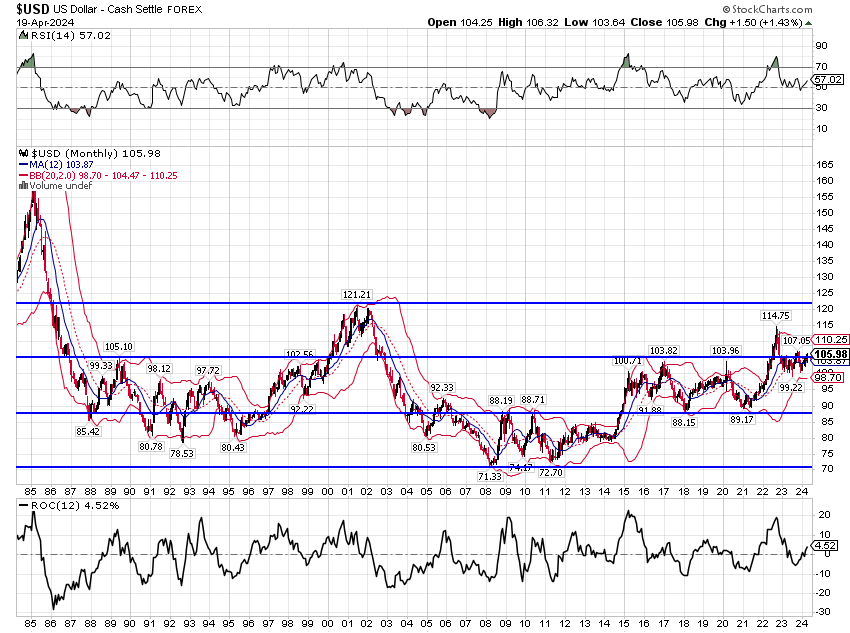
The dollar was unchanged last week and for the last six months. Is the short term uptrend coming to an end? The intermediate term trend is still sideways and the long term trend is still up. The really, really long term trend since the late 1980s is also sideways with current readings near the top of the neutral range.
The 10 year yield rose about 11 basis points last week as the flight to safety bid based on the Israel/Iran conflict faded. The economic data was mixed with housing data weak and retail sales better than expected. There’s a lot of important data out this week including Q1 GDP, Personal Income and Spending and the all important PCE inflation figures for March. The short and intermediate term trend for the 10 year rate is up while the long term is sideways.
Markets
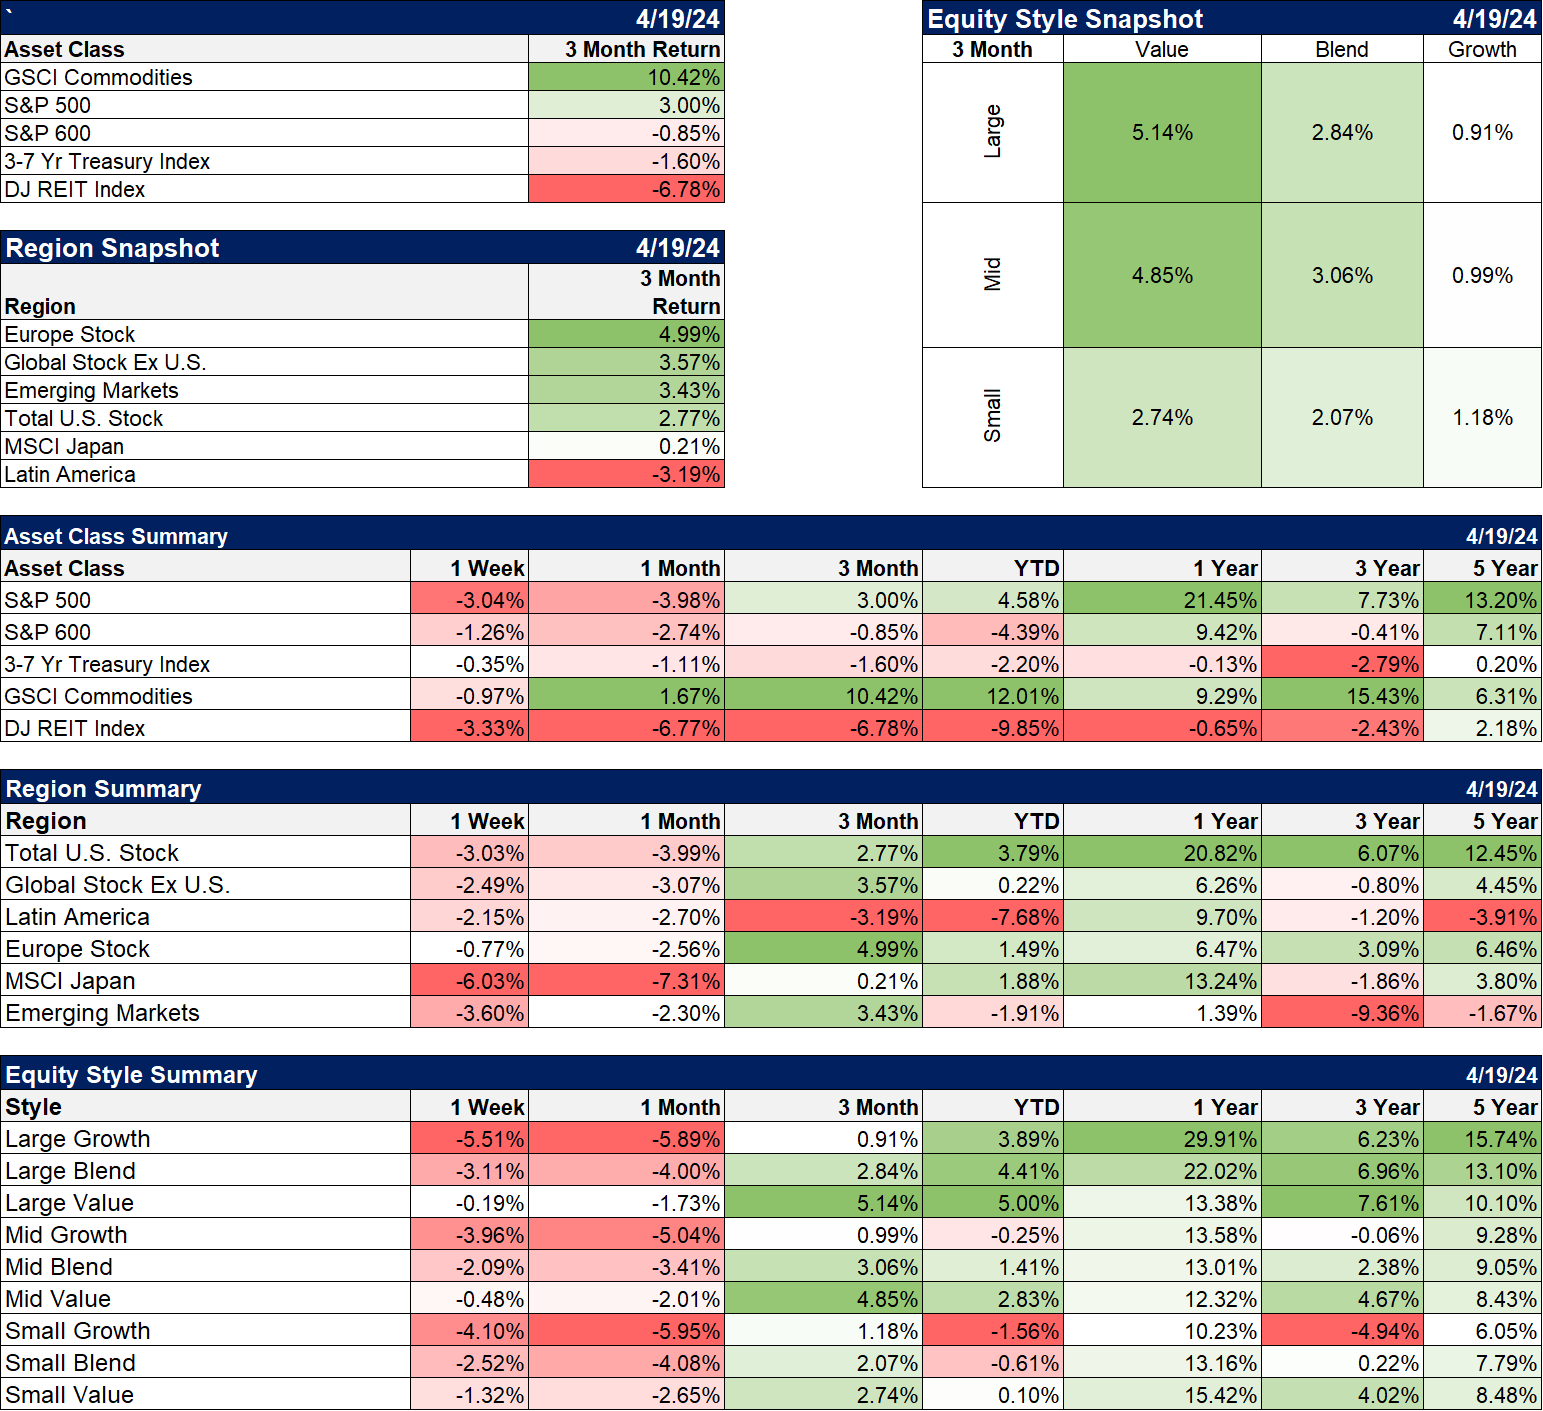
As I said above, I think there are some long term trends that are changing. Growth stocks have outperformed for a long time but I think the transition to value is already underway. The transition from growth outperformance to value outperformance can take a while and it can be subtle but with 3 year returns once again favoring value and the five year gap continuing to narrow (small value is already ahead of small growth in the five year rank), I think the shift is on. Note: the value and growth indexes in the chart below are the CRSP indexes, not Russell or S&P. S&P 500 value has outperformed S&P 500 growth over the last 3 years 31.5% to 17.6% while Russell 1000 growth has outperformed Russell 1000 value by 25.3% to 17.1%, a near mirror of the S&P indexes. In small cap, the Russell 2000 value is outperforming Russell 2000 growth over the last 6 years; that is not a new trend.
The other trend that seems to be shifting is commodities, which performed very poorly during the rising/strong dollar period that has prevailed – mostly – since the 2008 crisis. Commodities now have the best return over the last three years for the asset classes we track closely. The unusual thing about that is that the dollar is actually up over the last 3 years, not normally a friendly environment for commodities. Gold has also outperformed the S&P 500 over the last 3 years. Whether that is telling us something about the future course of the dollar or whether something has fundamentally changed in the dollar/commodities relationship is impossible to know right now. It is also a reminder and reinforcement of what I said above; the historical relationships on which we base tactical changes don’t always hold true. That’s why we don’t make all or nothing changes. Our strategy calls for us to have exposure to gold and commodities at all times and thank goodness.
Sectors
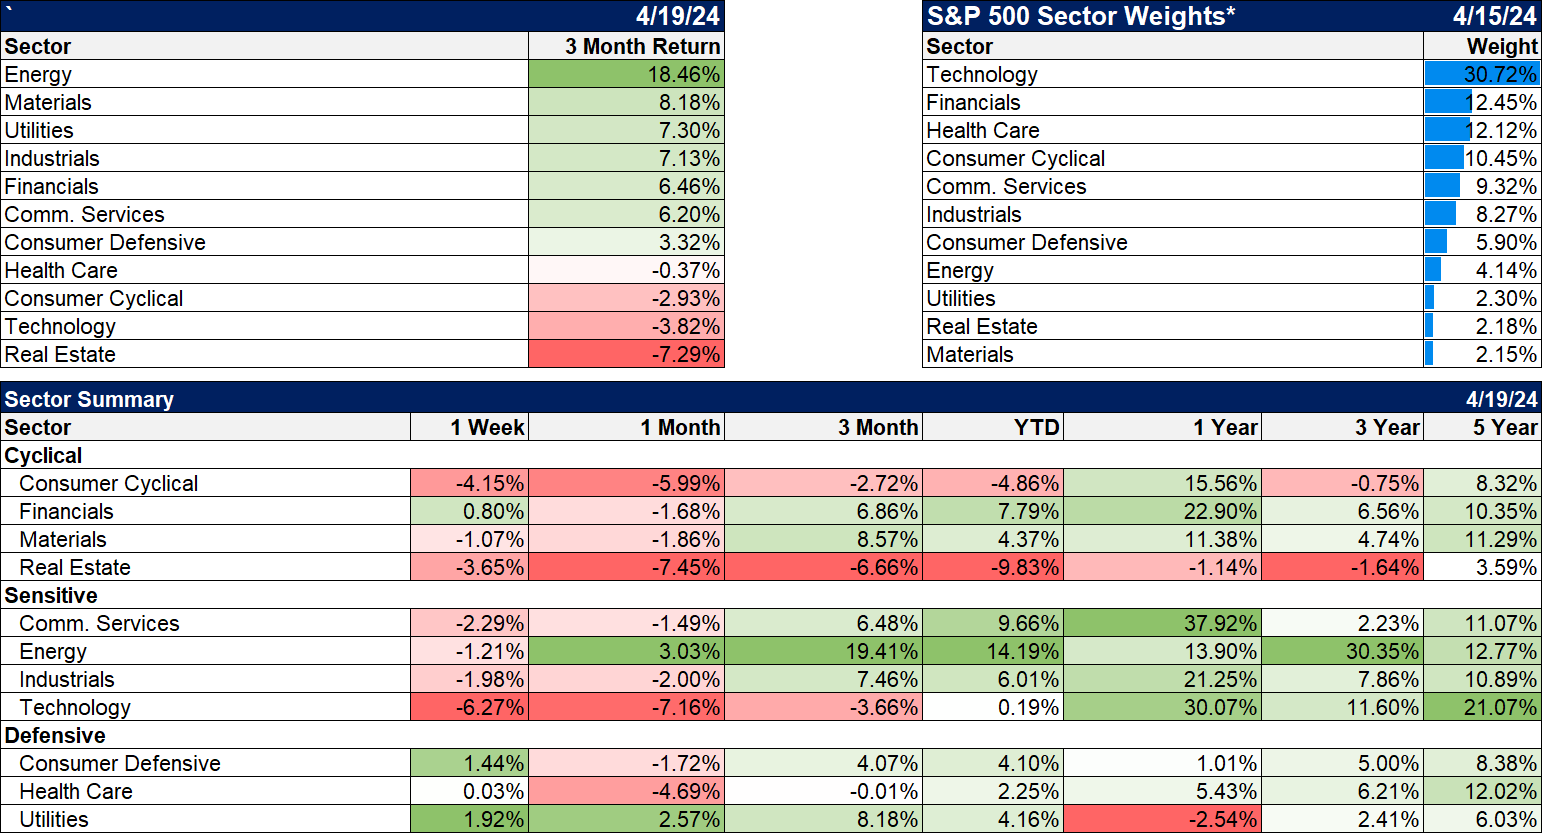
Technology finally joined in the correction last week and was the downside leader for the week. It’s also closing in on real estate for the worst performance over the last 3 months. Defensive sectors led last week but have performed poorly YTD and over the last 1,3 and 5 year periods. Energy continues to lead over the YTD and 3 year periods.
Market/Economic Indicators
The economic data last week was generally positive but housing continues to struggle. It is about the only part of the economy getting hit by higher rates.
- Retail sales were up more than expected at 0.7% February to March. That was true too of retail sales ex-autos and gas. Inventories were up as expected.
- The housing market index (HMI), a measure of builder sentiment, was unchanged (51) and that was all of the good news on housing for the week.
- Empire State manufacturing index improved to -14.3 from -20.9 but it is still negative. The reading was less than expected and showed weakness across the board.
- Housing starts and permits were both less than expected.
- Industrial production rose 0.4%, as expected. Manufacturing production rose 0.5%.
- Jobless claims remain low at 212K.
- The Philly Fed index was much better the the Empire State version. It rose to 15.5 from 3.2; new orders rose to 12.2 from 5.4 but prices paid also rose, to 23.0 from 3.70.
- Existing home sales were down 4.3%, about as expected.
Credit spreads widened somewhat last week but are still quite low.
Joe Calhoun
More By This Author:
Are Higher Interest Rates Good For The Economy?Market Morsel: Cash And Carry
Weekly Market Pulse: A New Paradigm?
Disclosure: This material has been distributed for informational purposes only. It is the opinion of the author and should not be considered as investment advice or a recommendation of any ...
more

