Weekly Market Pulse: Happy Days Are Here Again!
Your cares and troubles are gone
There’ll be no more from now on!
Happy days are here again!
The skies above are clear again
Let us sing a song of cheer again
Happy days are here again!
Lyrics: Jack Yellen, Music: Milton Ager
That’s certainly how it’s felt since the turn of the new year with the Nasdaq up nearly 15%, European stocks continuing to recover, emerging markets anticipating a Chinese recovery and a solid January for the S&P 500. Bonds have been cooperating too with the longest term bonds putting up returns that rival stocks while interest rates have avoided a collapse that might indicate recession is nigh.
Indeed, it is the lack of recession that is driving this rally that includes everything but commodities (except for a small rally by gold). It is also being egged on by, of course, the fall in the inflation measures the Fed is so concentrated on. A few months ago, it was consensus that a quick drop in the CPI toward the Fed’s target of 2% would require divine intervention. Now it doesn’t seem so far fetched and I’ve heard rumors of prayer groups being formed among FTX creditors. Okay, those might not be connected but still, a little prayer can’t hurt.
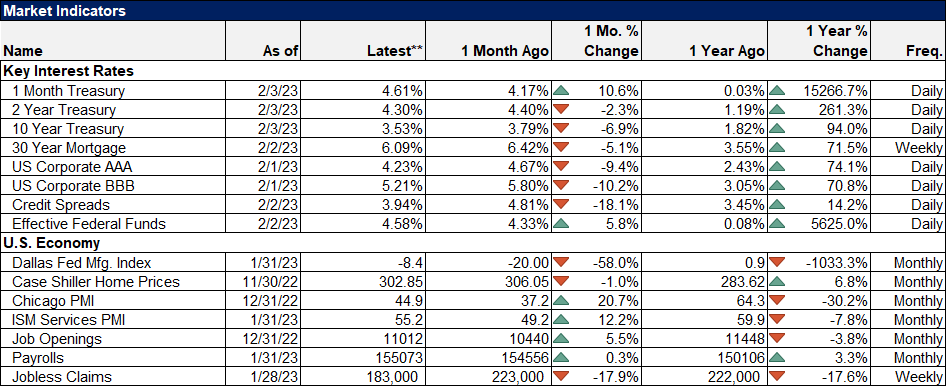
Stocks were down Friday on a very good employment report and some other positive economic data as interest rates rose across the curve. Of course, everyone who wants to see something wrong with the economy – economic bears still preaching their doom and gloom – found something wrong with the report. Oh, it was the annual revisions or seasonal adjustments or the census updates or whatever else that made it seem like someone had a finger on the scale. The ADP report earlier in the week showed only a 106k gain in jobs but it was a positive report. As usual the truth is probably in the middle. Whatever the truth about this particular employment report, this isn’t recession.
Frankly, I don’t think the employment report was the most important of the week. Of greater importance was one report that everyone saw on Friday and another that not many paid any attention to. The first is, of course, the ISM Services index released an hour and half after the employment data. That reading had dropped precipitously last month into contraction territory at 49.2. I said at the time that, given the extreme cold weather and travel disruptions in December, that it would be wise to wait to see if January confirmed the drop, which it did not. The rebound, all the way back up to 55.2, would seem to confirm that last month was about the weather.
Our thesis here for some time has been that the goods economy would correct back down to trend while the services side would recover back up to trend. Those somewhat offsetting moves – services is much larger than goods so it has a bigger impact – have played out over the last year mostly as we expected. Real consumption of goods rose 0.2% last year while services spending rose 3.3%. And now, with both back to trend (see This IS the Soft Landing), the real question is what happens now? I have been thinking that a good guess is that goods and services both overshoot the trend, goods below and services above. Because that’s what these kinds of things often do.
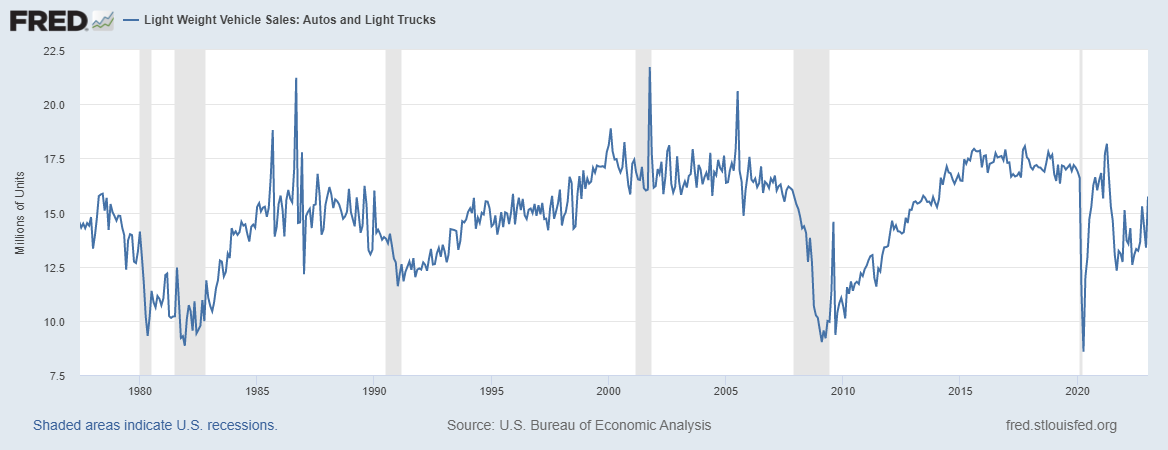
But the second report, the one that no one paid much attention to, put part of that equation into doubt. Auto sales rebounded by a whopping 17.7% in January from December. Yes, that’s a month to month change; the change from a year ago is just 4.1%. Auto sales fell in the second half of 2021 – chip shortage – and bottomed in September ’21 at just 12.3 million annualized units. That is a level we associate with recession and it had an impact on the economy.
Sales got back above the 15 million level a couple of times (January and October of last year), but fell back to the 12.5 million level in between. Now, we’re at the highest level since June ’21 and the bottom end of what I would expect in economic expansion. If this is the start of a trend that takes auto sales back up to the 16 to 18 million level we normally see during economic expansions, then that will have an impact on the economy too. It is, like last month’s ISM report, just one month though so we need to see follow through next month.
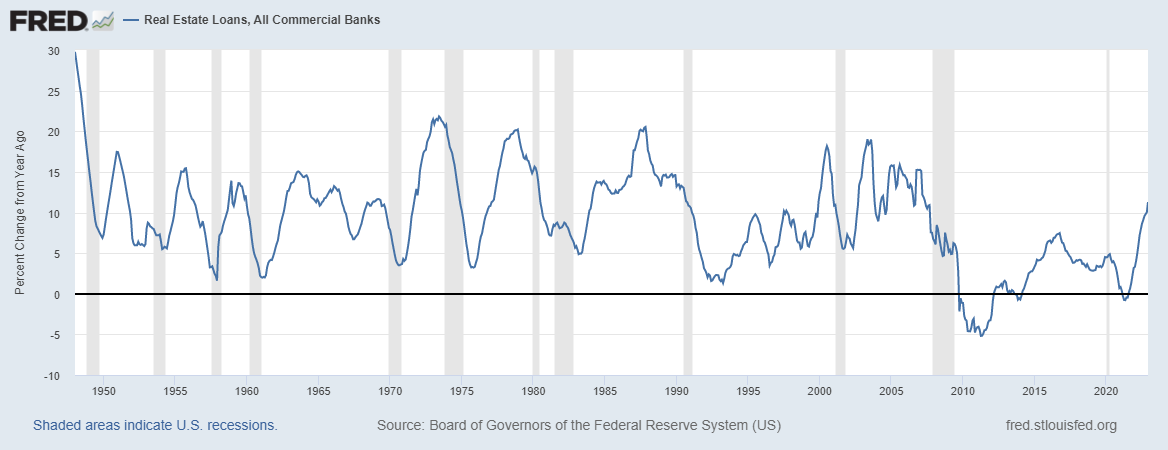
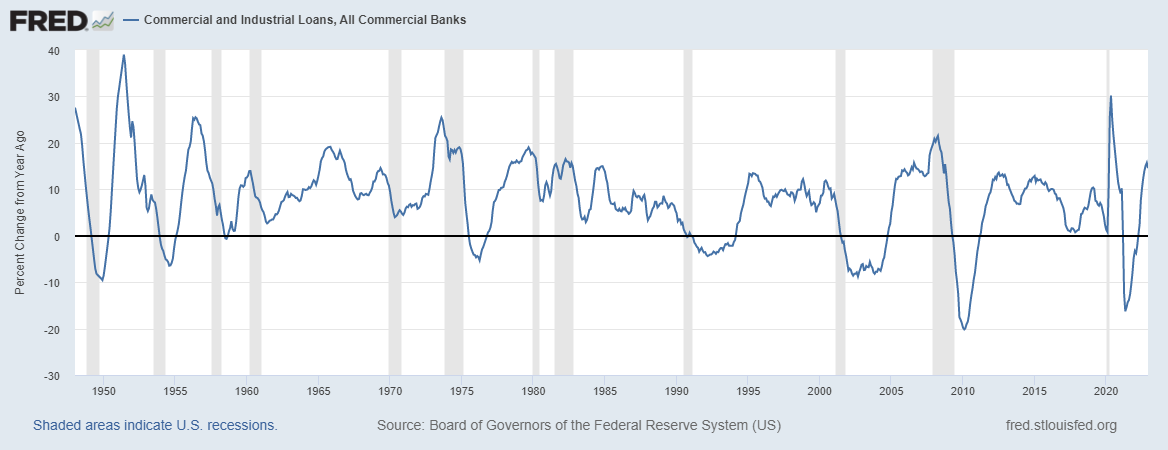
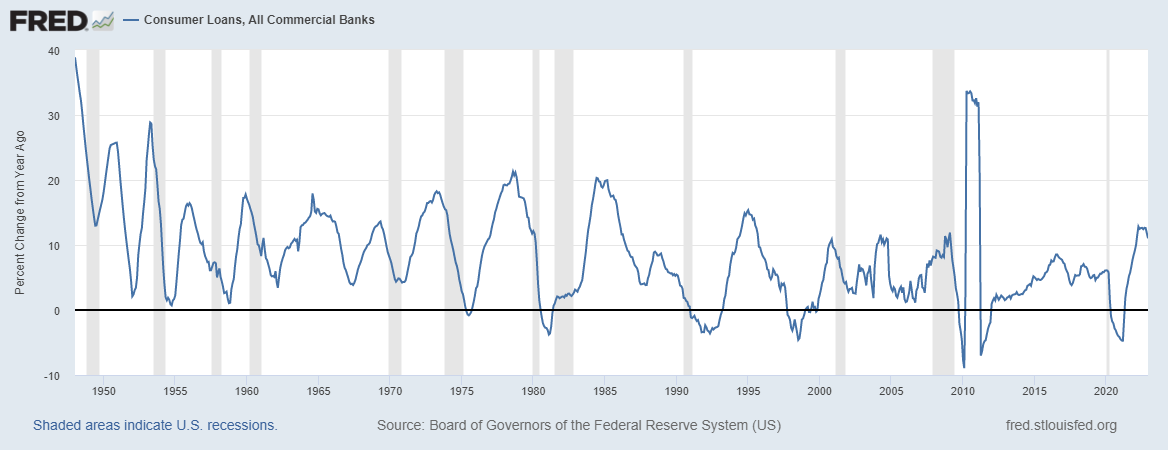
That spike in auto sales is just one more indication that, despite Jerome Powell’s victory lap last week, the Fed’s rate hikes really haven’t done all that much to reduce demand. Presumably, the transmission mechanism for higher rates to work on the economy would be through borrowing and lending. Raise rates and demand to borrow should fall along with the desire to lend. Evidence of such a slowdown is hard to find.
Everyone knows that residential real estate has slowed but has overall real estate borrowing/lending? No, in fact it is surging, up 11.3% in the last year and nearly 2% in December alone, no slowdown in sight:
Commercial and industrial loans are also up strongly, 14.6% yoy.
Consumer loans are up 11%
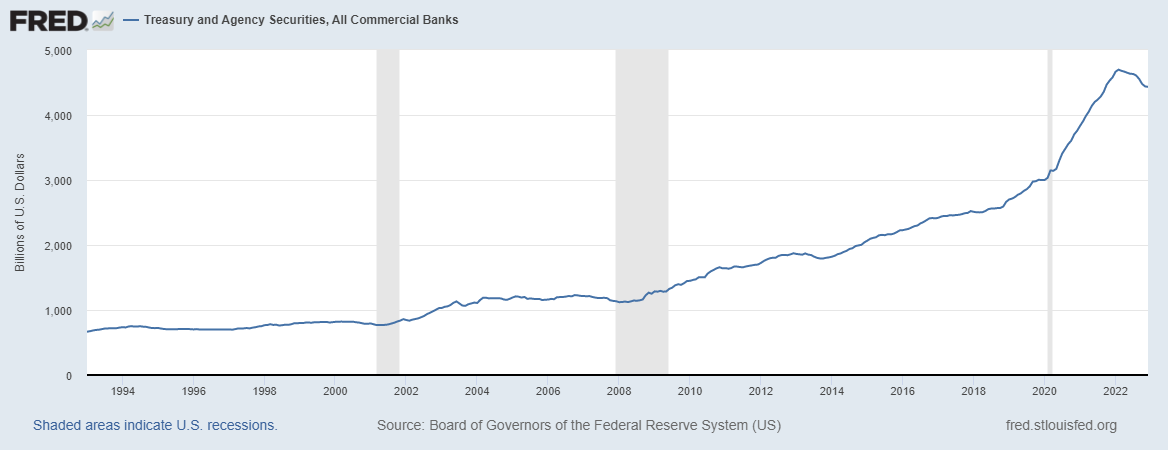
And banks are actually reducing their Treasury holdings:
I don’t see much impact from higher interest rates here. And I’m not shocked by that because household balance sheets changed dramatically after all the COVID relief. Household net worth rose from $116.539 trillion in Q4 2019 to $143.278 trillion in Q3 2022 (we don’t have Q4 numbers yet). As you might guess that didn’t happen because we paid down debt; household liabilities were up $2.7 trillion in the same time frame. But that means assets rose by $26.7 trillion over that time.
A lot of that is due to rising real estate and stock prices but nearly 19% of the total is from three cash/near cash categories:
- Checkable Deposits +$3.9 trillion
- Time deposits +$610 billion
- Money Markets +$507 billion
In fact, those three categories of liquid or near liquid assets, by themselves, exceed total household liabilities by a small amount. That represents a positive change of $2.3 trillion from prior to COVID. Total liabilities as a percent of household disposable income isn’t as pretty with that ratio now at 103% but that is a long way down from the 136.6% it was in Q4 2007. The US does indeed have some prodigious debts but we also have a lot of assets.
What that means to me is that knocking down nominal GDP growth is not going to be an easy task. That doesn’t necessarily mean the Fed is going to go back on the warpath. Remember, NGDP is made up of two components: real growth and inflation. A reacceleration in NGDP could just mean an acceleration in real growth. Or not. If you learned nothing else from last week’s economic reports let it be that anyone trying to predict the future course of the US economy is on a fool’s errand.
Environment
The dollar and bond yields were up last week with all of the gains coming on Friday in the wake of the positive economic news. Bonds were actually recovering a bit (yields falling back)
until the ISM services PMI at 10 am which showed a big rebound from the December reading below 50 that got all the economic bears hearts racing. I said last month not to get too excited about it because of the extremely cold weather in December and sure enough we’re right back where we were before one bad reading. There were certainly some nits to pick with the employment report but the ISM was strong across the board.
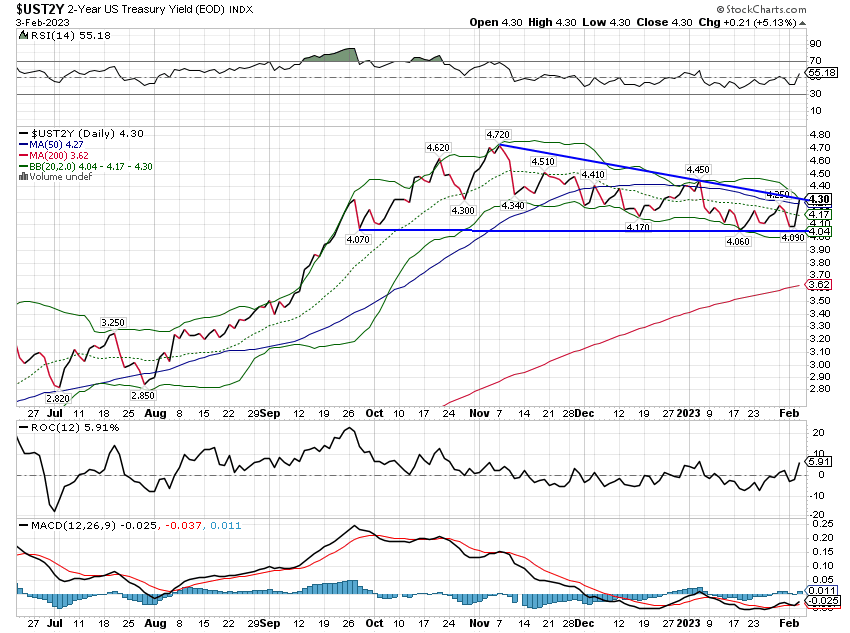
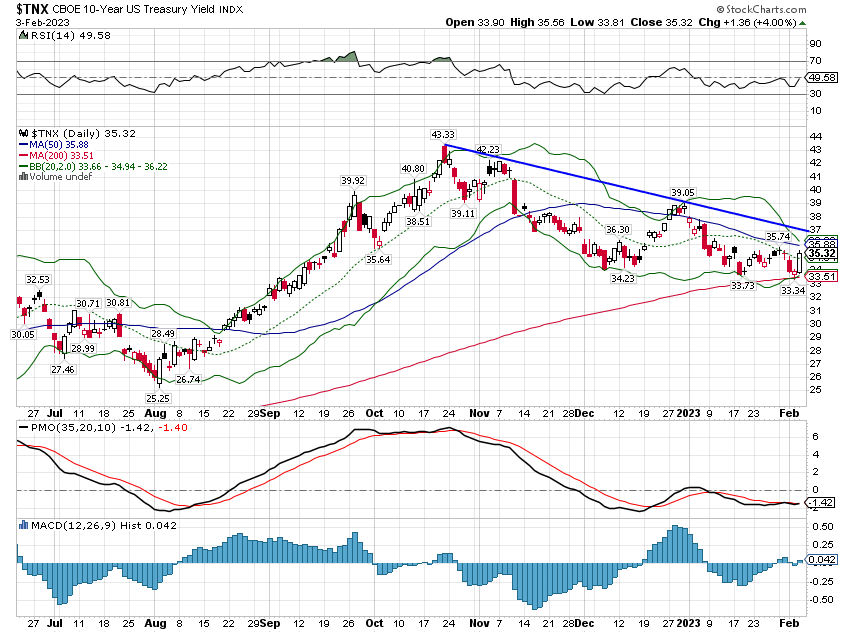
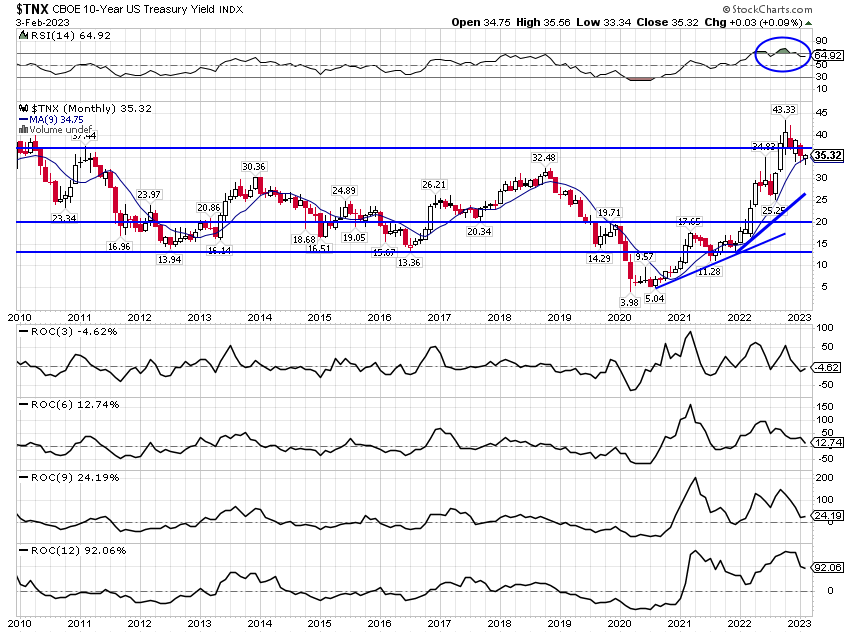
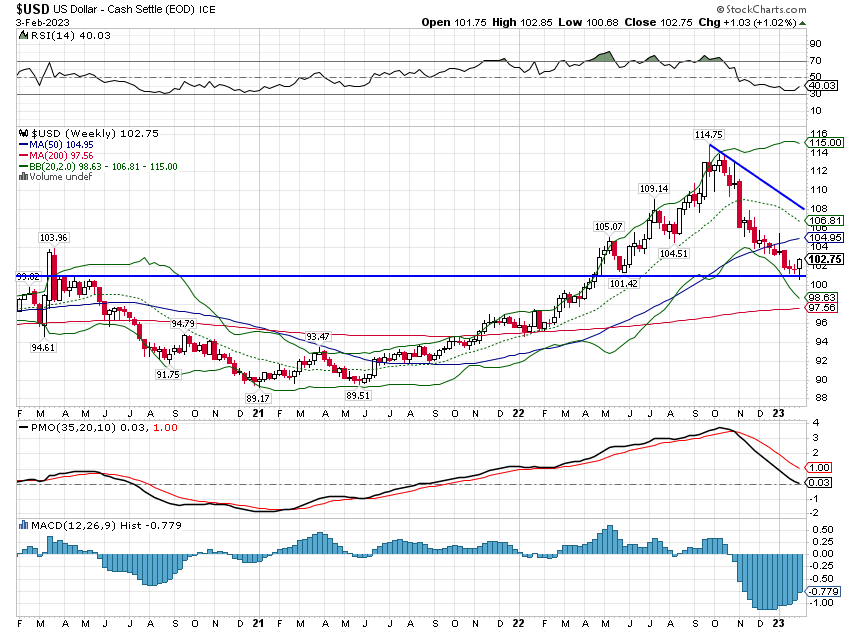
On the other hand, the move in rates and the dollar last week didn’t even change the short term trend which remains down for both. There is nothing unexpected here. For rates, the short term trend is down for the 2 year and the 10 year while the intermediate term trend is still up. For the long term trend of the 10 year if you’re looking at the last 10 to 12 years, it would be hard to call the trend anything but neutral. For individual investors it is the short and intermediate term trends that really matter.
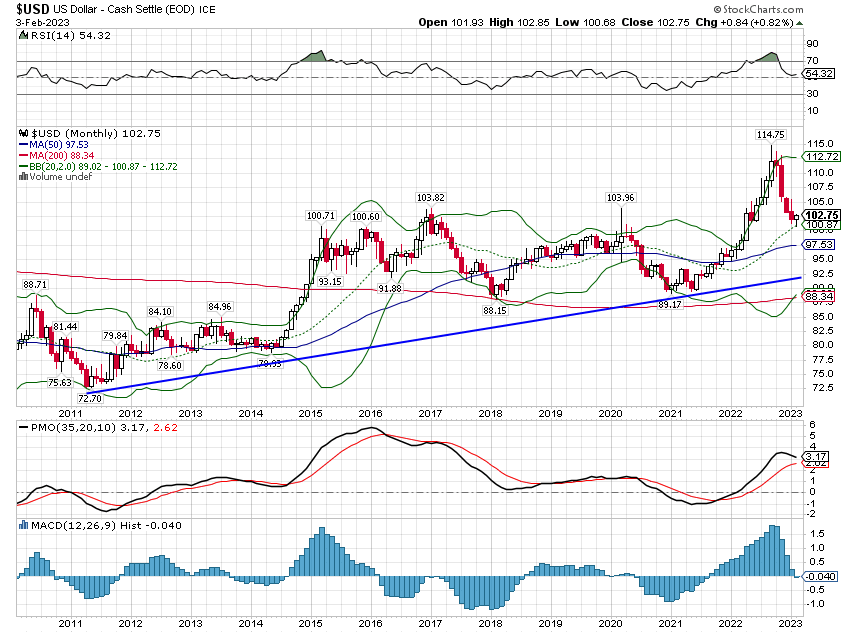
The dollar bounced pretty much on cue and the short term trend is obviously still down. But it is still oversold and a further bounce should be expected with a target of around 105/106. The intermediate term trend is still neutral. Like the 10 year yield, the long term trend depends on your perspective. For our purposes, a decade lookback shows the dollar in an obvious uptrend.
Markets
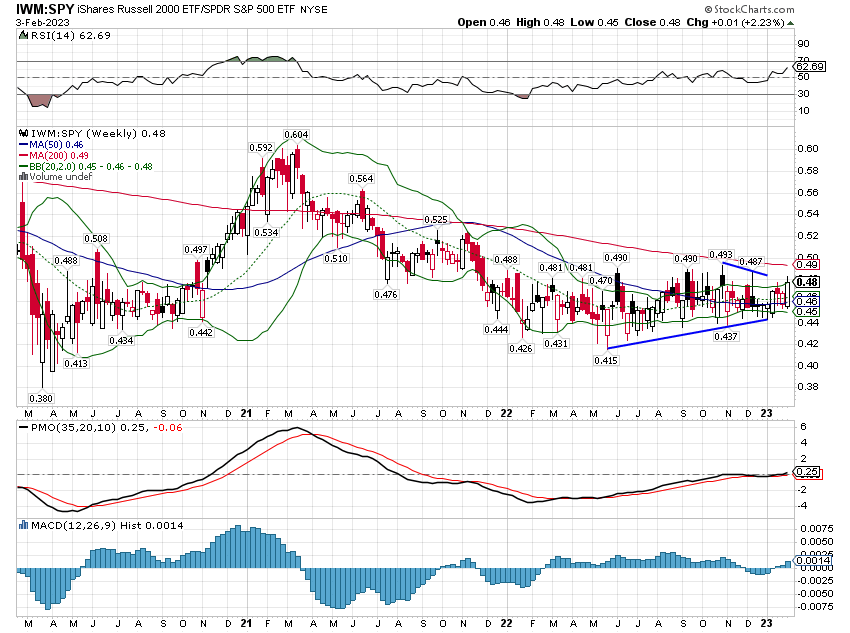
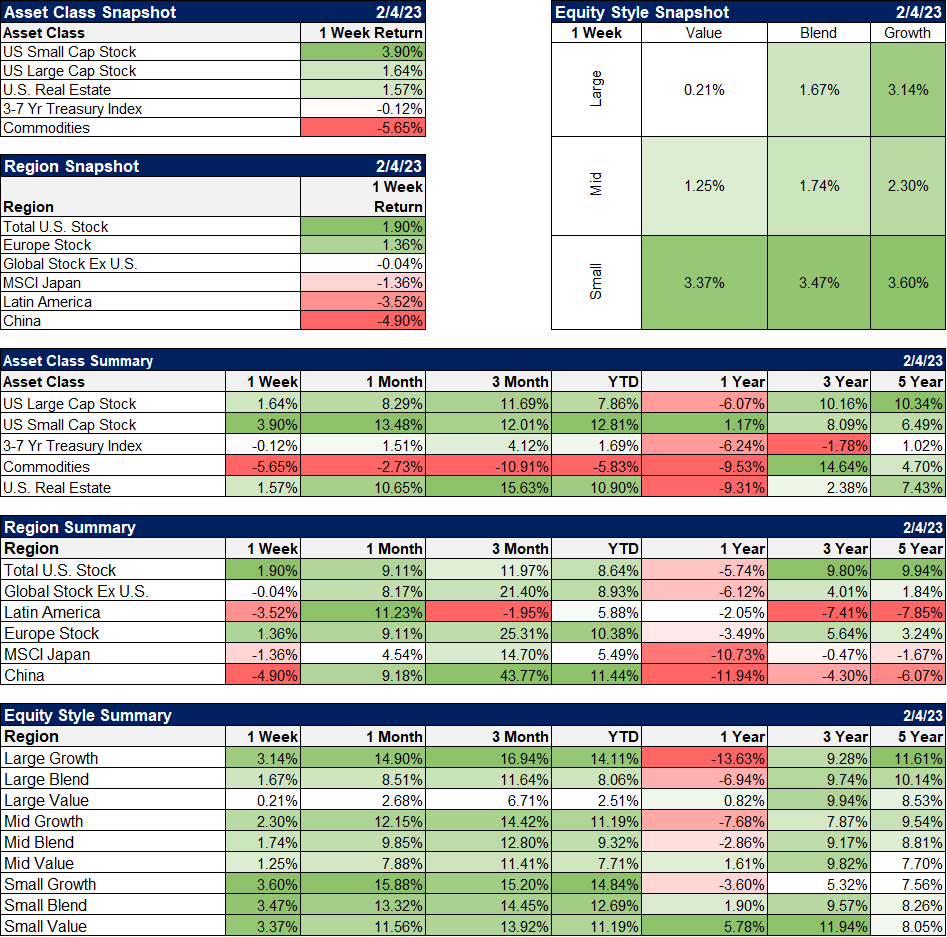
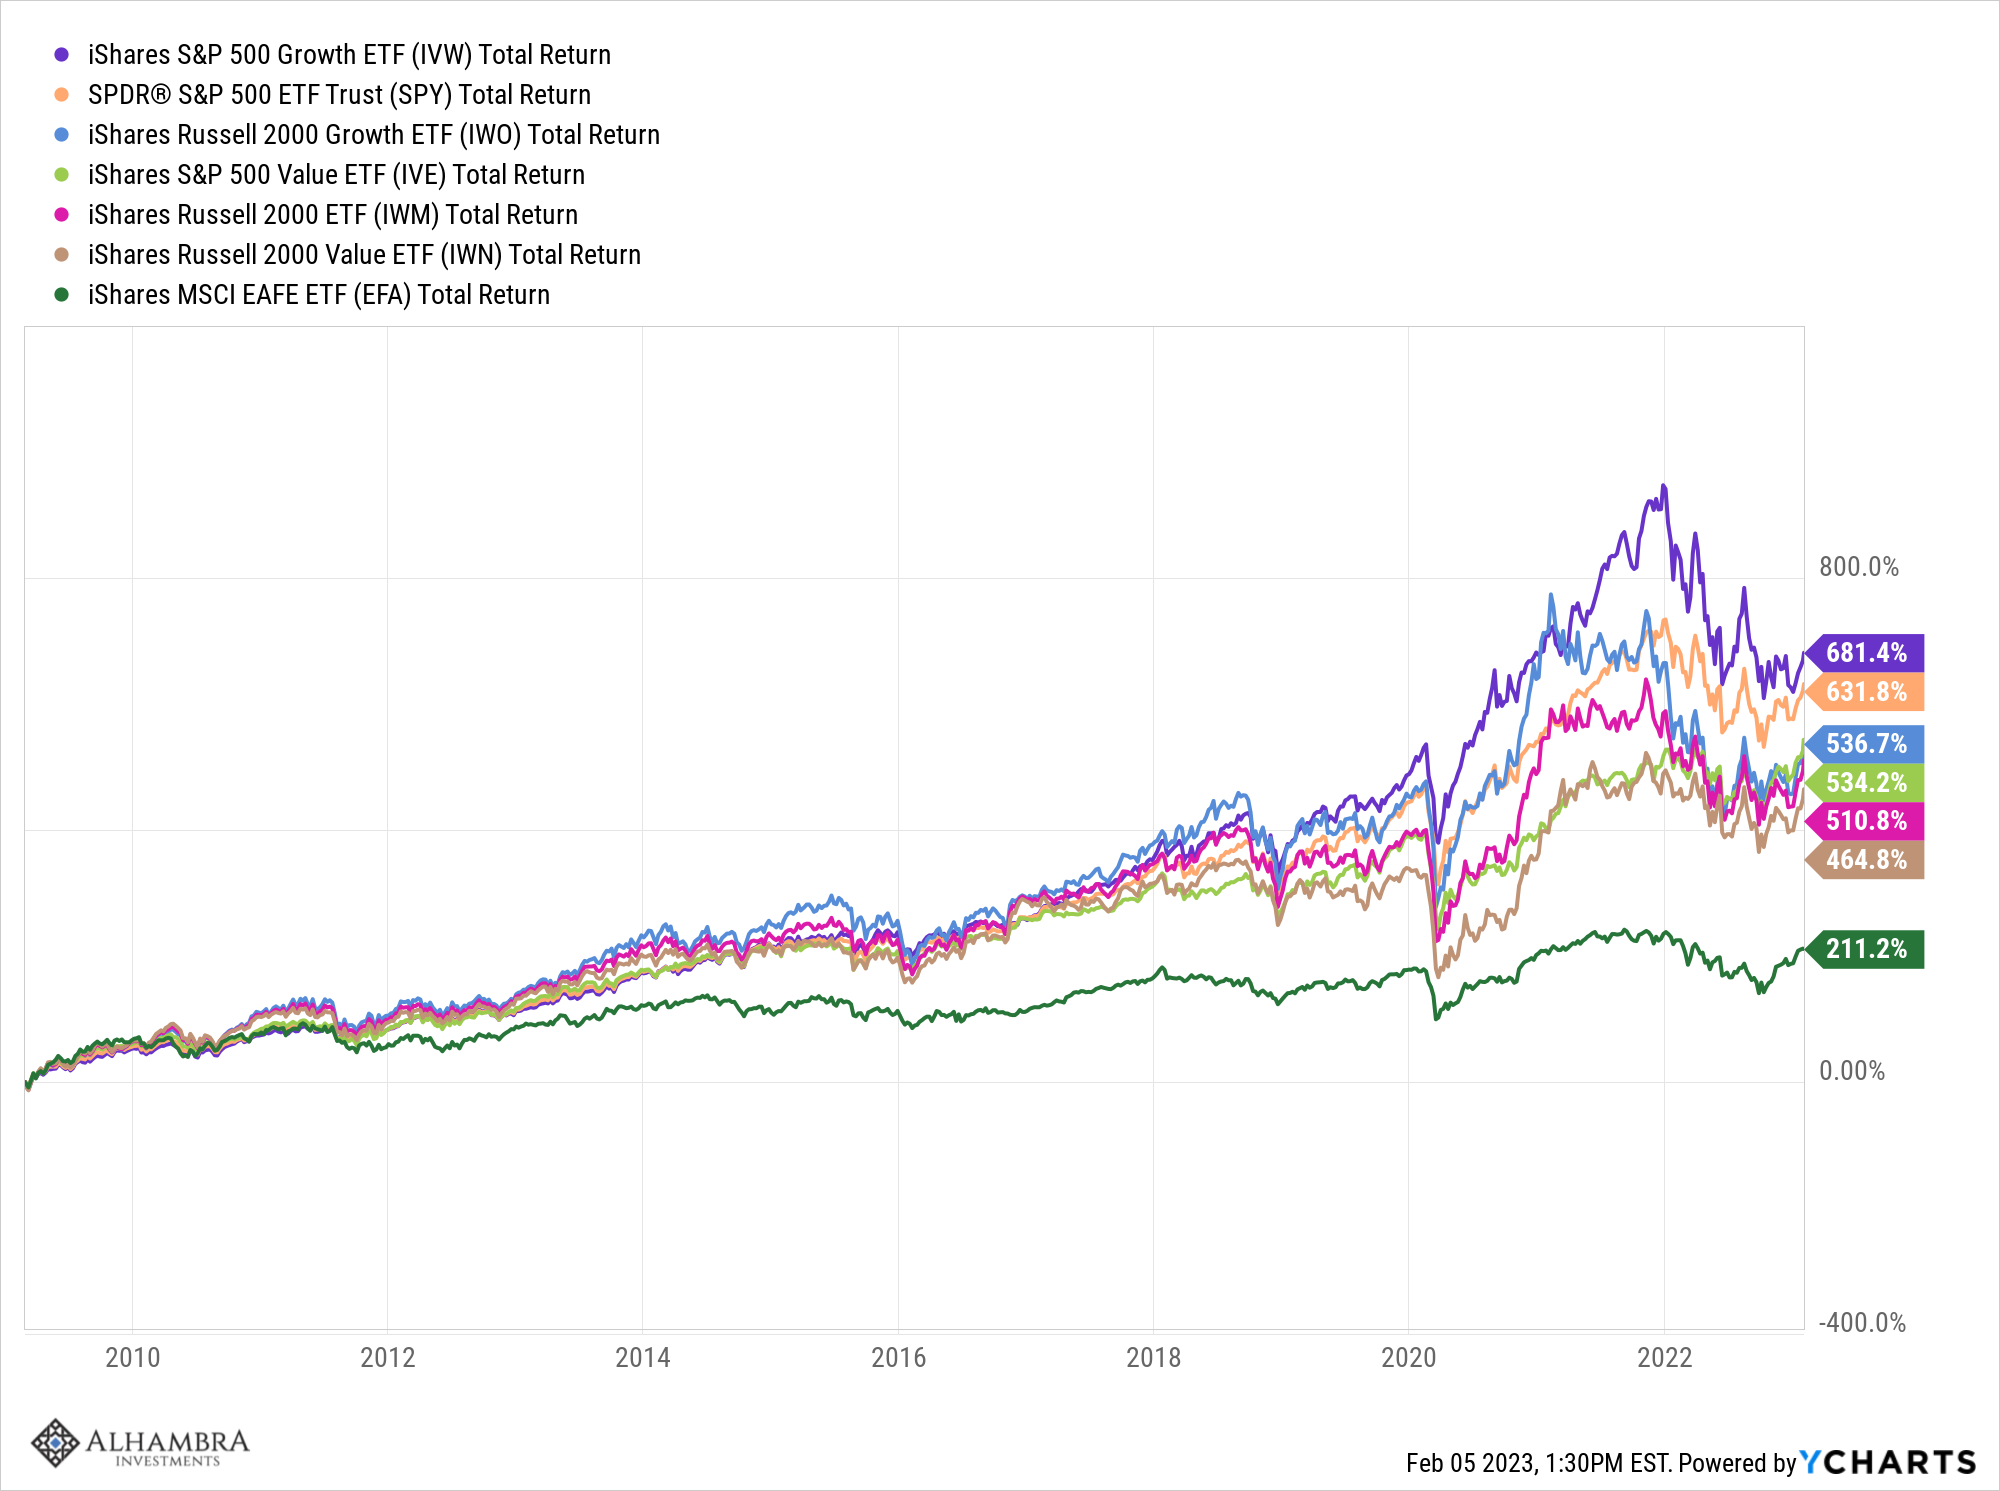
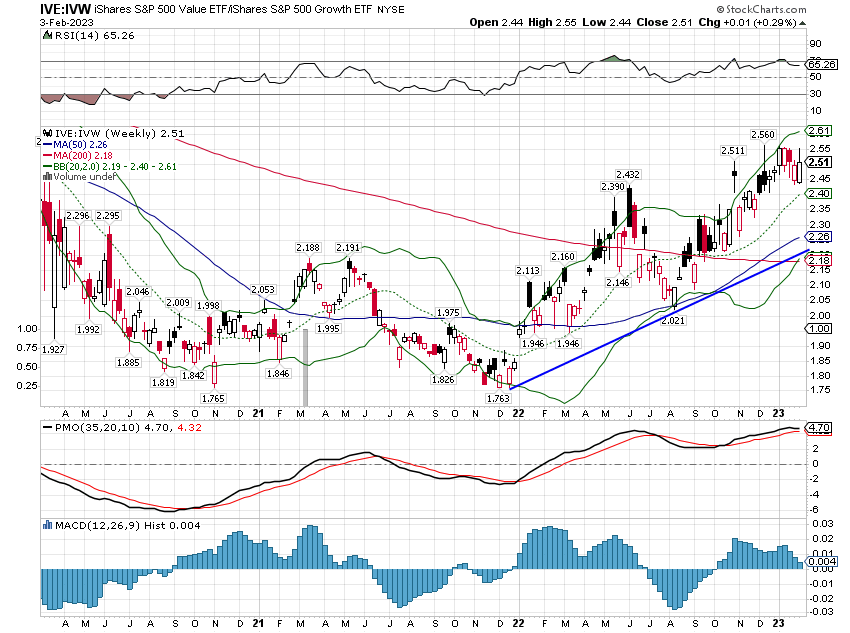
Stocks were higher last week but the S&P fell back on Friday and finished the week up 1.64%. Growth outperformed value but the degree faded as you move down the market cap scale. Which is also why small cap outperformed large overall last week. That is becoming a durable trend with a pretty steady, if mild, uptrend since May of last year. In fact, small caps have outperformed large cap since mid-March 2020 but the ride has been bumpier than the large stock indexes.
There have been three major trends in stocks in place in the post 2008 financial crisis period:
- US has outperformed international
- Large cap has outperformed small cap
- Growth has outperformed value
All of those trends are affected by the dollar and in danger of reversal. These really long term trends are the ones you really need to get right.
What is extraordinary in a way is that all these long term trends are still in place. All of them are in short term uptrends that started when the dollar peaked. Further gains will likely require a weaker dollar which seems a little less likely after last week’s US economic data.
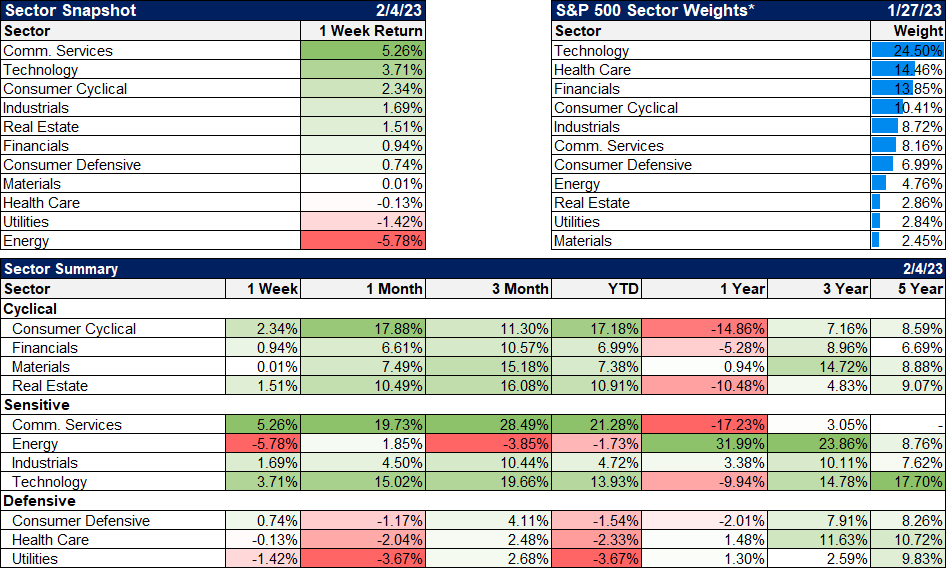
Communication Services again led the way on a sector basis. The sector got a huge boost from Meta’s post earnings performance (up 22.9% for the week). What’s also interesting about that is that Meta (nee Facebook) is now in the S&P 500 value index, not the growth.
The YTD performance by sector offers an interesting insight into market psychology. The biggest winners are Communication Services (+21.3%), Consumer Cyclical (+17.2%) and Technology (+13.9%). The biggest losers are Utilities (-3.7%), Health Care (-2.3%) and Energy (-1.7%). The winners are pro-cyclical while the losers are all defensive except for energy. Consumer defensive is the 4th worst performing sector. So, the market appears to be betting on growth, not recession. And so far, that has proven accurate.
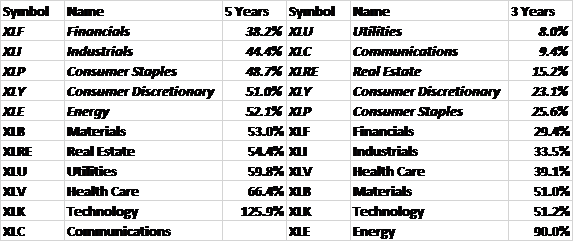
Here’s another look at sector returns, focusing on 3 and 5 year returns. We monitor these to look for poor performers that may be improving. We also look at 10 year returns (not shown here). Communication services, the best performer YTD had the second worst performance over the last 3 years and it was worst at the beginning of the year. A couple of years ago, the worst performing lists were dominated by energy which is now the #1 performer over the last 3 years. Financials and industrials are the worst performers over the last 5 years and both would likely require a better economy to improve.
Economy
Credit spreads fell under 4% last week, only about 50 basis points higher than they were a year ago and well below the long term average of 5.4%. Recession in 2023? Maybe, but not with spreads at these levels. There was some improvement in the economic stats released last week besides the payroll report. The Dallas Fed survey improved, home prices continued to fall and job openings grew. But the most positive report by far was that ISM services index jumping back to 55.2 from 49.2. Business activity (60.4), New order backlog (52.9), New Orders (60.4) and employment (50) all improved within the survey.
In reality, none of the existing trends in markets changed last week despite a rather dramatic Friday. The trend for interest rates and the dollar is still up. The economy is still not in recession. The Fed is still near the end of its latest hiking cycle something that was true last month and the month before. US stocks are still in a short and long term uptrend. The intermediate trend is neutral with basically no change since May ’21. International stocks are in a short term uptrend versus US stocks but the long term outperformance of the US is intact. Value is outperforming growth.
One thing that has changed is the market’s focus on the Fed. We got some jumpy moves after the meeting but I didn’t even remember the FOMC met last week until I was reviewing my notes. The Fed is moving out of the limelight and it’s about time in my opinion. That could change if CPI starts to reaccelerate but for now, the mantra has changed from don’t fight the Fed to don’t fight the tape.
We’re due for a correction of this rapid uptrend and sentiment has gotten a bit too frothy recently so I wouldn’t be in a hurry to deploy capital. And there is still the matter of an inverted yield curve that says recession will come at some point even if not on the previously agreed schedule. There are reasons to be a little more optimistic right now but investors can never be comfortable. After all, Happy Days Are Here Again was written in 1929…before the crash.
More By This Author:
This Is The Soft Landing. What Now?
Weekly Market Pulse: First, Kill All The Speculators
Weekly Market Pulse: A Fatal Conceit
Disclosure: This material has been distributed for informational purposes only. It is the opinion of the author and should not be considered as investment advice or a recommendation of any ...
more

