
Weekly Market Outlook - Not Quite The Decisive Victory The Bulls Were Hoping For

Image Source: Pixabay
There's certainly no reason to worry, but there's not exactly reason to celebrate either. The market managed to log a gain last week, but it didn't decisively clear the key technical hurdles that would signal or suggest the breakout's got legs. One rough day could still easily up-end the entire effort thus far.
We'll show you why in some detail below. First though, let's recap last week's most important economic reports. November's surprisingly strong jobs report is a double-edged sword investors aren't sure what to do with now.
Economic Data Analysis
First things first. Last week we rounded out our look at consumer sentiment data with the Conference Board's consumer confidence report for November being posted on Tuesday. It fell about as much as expected -- which wasn't much.
But, the slide most definitely puts the measure back in a downtrend. Paired with the even-more-problematic print for the University of Michigan's consumer sentiment index, it's not a stretch to suggest people are going to be hesitant to do their part in keeping the economy from slipping into a recession.
Consumer Sentiment Charts
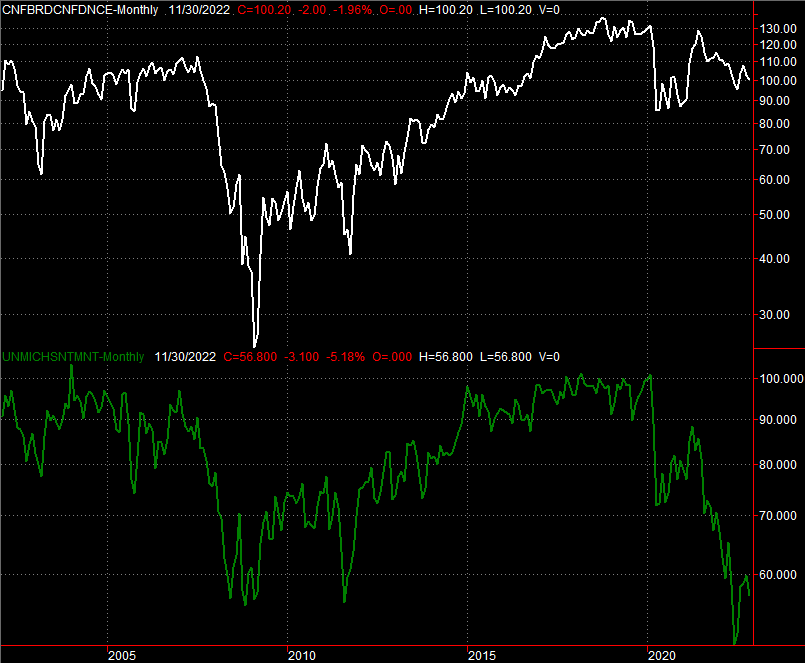
Source: Conference Board, University of Michigan, TradeStation
In this vein, housing prices continue to edge lower. The Case-Shiller Home Price Index logged its third-straight decline in September, and while the FHFA Housing Price Index essentially came in flat for the same month, it's clearly fighting an uphill battle.
Home Price Charts
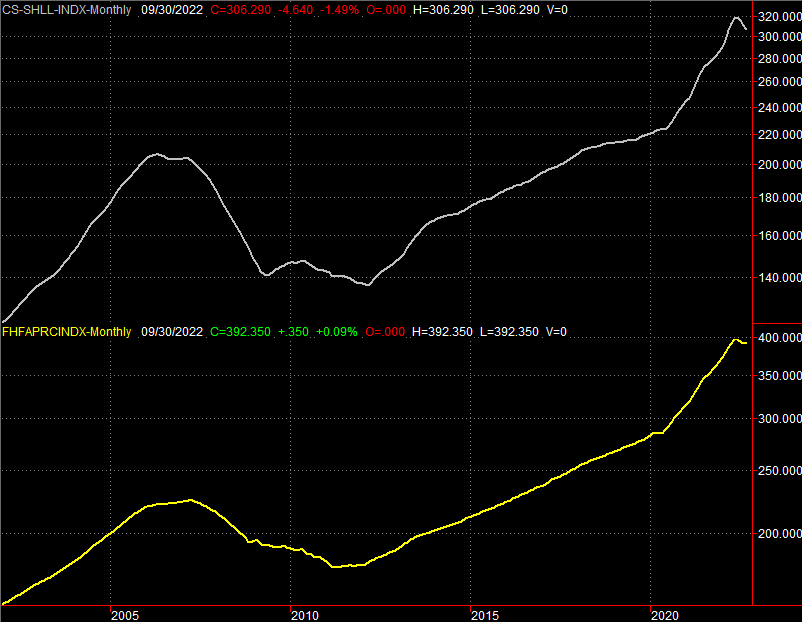
Source: Standard & Poor's, FHFA, TradeStation
And remember, those figures are now three months old. Much has happened in the meantime, with most of its being for the worst.
Last week's biggie, of course, is November's jobs report. The nation added 263,000 payrolls last month, handily topping expectations of 200,000 and coming in near October's figure of 284,000. That wasn't enough to lower the unemployment rate. At 3.7% though, the unemployment rate's already about as low as it can feasibly go.
Payroll Growth and Unemployment Rate Charts
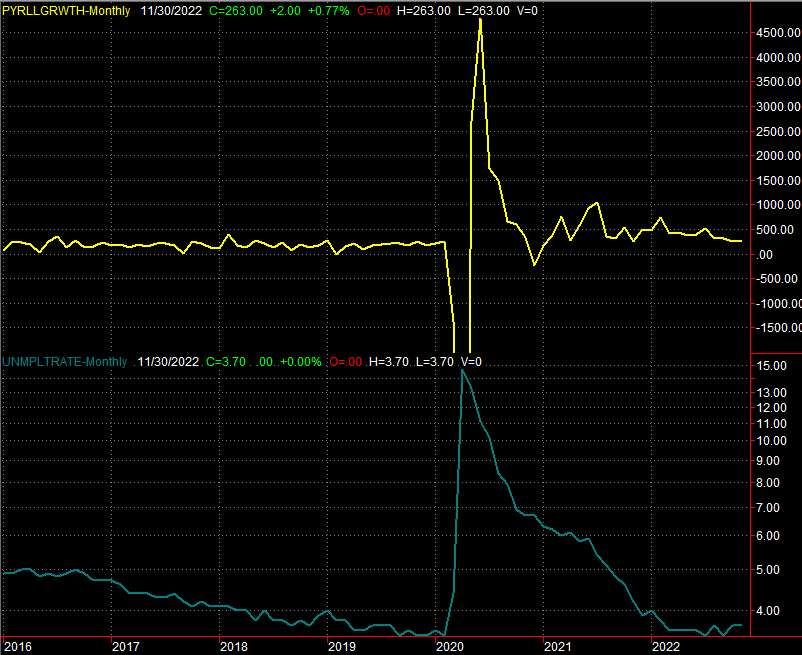
Source: Department of Labor, TradeStation
The numbers throw something of a wrench in the works. The Fed's been ratcheting up interest rates in an effort to curb inflation -- knowing that the move may also stifle the economy. The strong job growth number, however, suggests the economy is still a little too strong to allow inflation to be tempered a great deal.
It's possible the Fed's recent dovish talk and hopes for less aggressive interest rate hikes may have been premature. That was the knee-jerk assumption from investors early Friday anyway, when the market was rather deep in the red.
Stocks didn't finish Friday nearly as in the hole as they started the session, indicating traders aren't terribly worried about continued hawkishness. It's certainly something to keep in the back of your mind this week, however.
Everything else is on the grid.
Economic Calendar
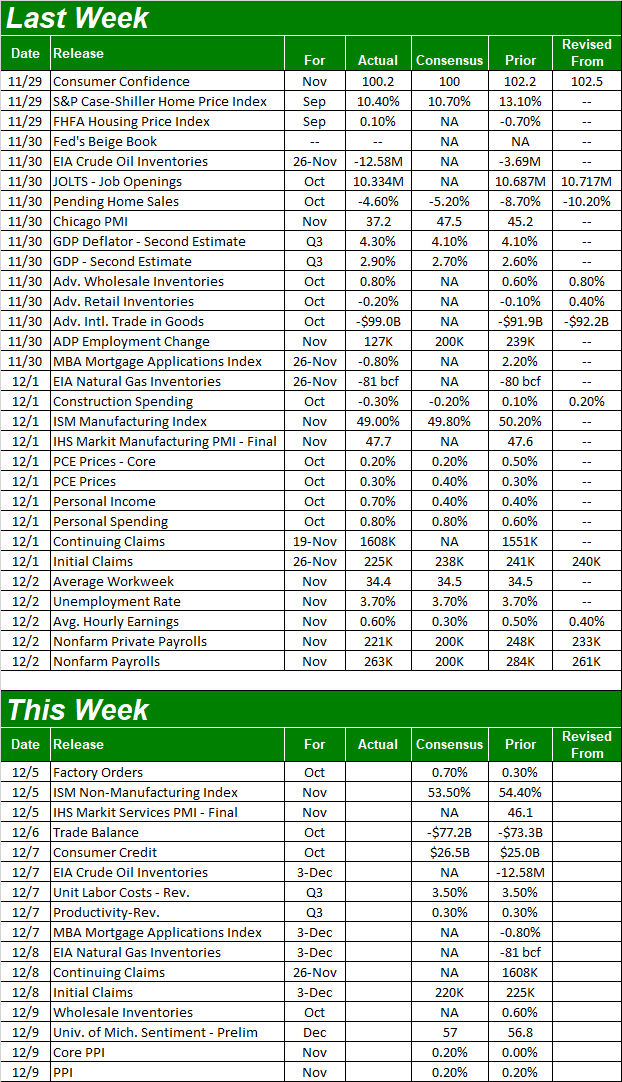
Source: Briefing.com
There's not quite as much in the lineup this week, but we're getting a couple of important reports.
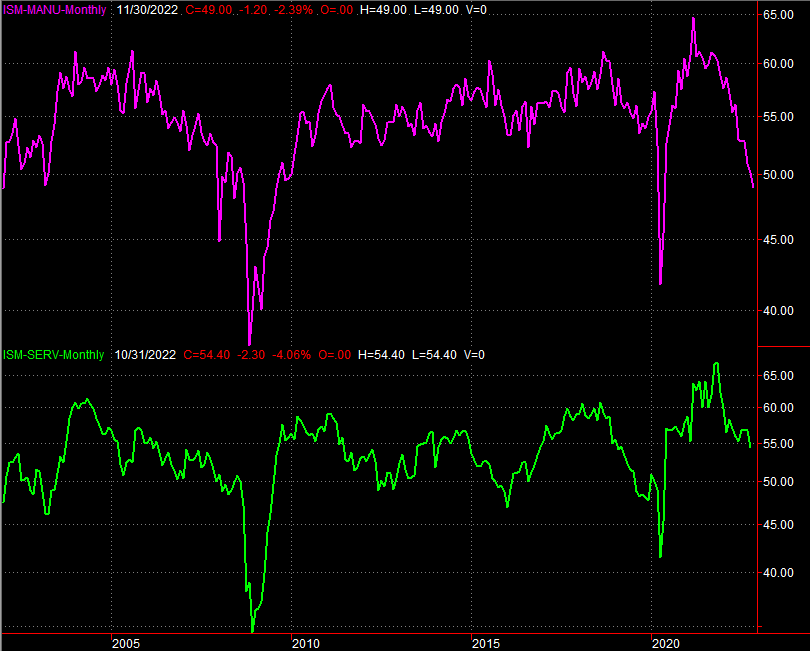
The first of these is the Institute of Supply Management's measure of service business's activity, following last week's update of the nation's manufacturing activity. The non-manufacturing index is projected to move a little lower, but should remain above the key 50 level.
The manufacturing index, however, slipped under 50 to a reading of 49 for November. That technically indicates economic contraction. And in both cases, the trend pointed downward.
Institute of Supply Management Manufacturing, Service Index Charts
Source: Institute of Supply Management, TradeStation
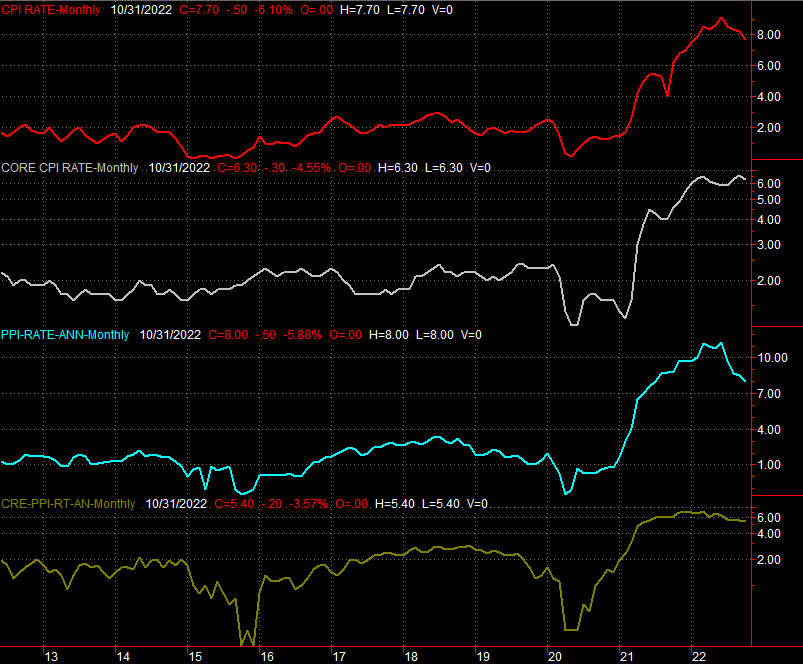
On Friday, we'll start (but not finish) the most recent look at the inflation picture, with producer prices due then. Price increases have been cooling, but they're still high, and aren't expected to change much at all with Friday's numbers.
Consumer, Producer Inflation Charts
Source: Institute of Supply Management, TradeStation
The consumer inflation figures for November are coming early next week. They'll be of great interest as well, since they'll still ultimately dictate when or if the Federal Reserve can slow down the rate hikes; strong job growth is only a by-product of a too-strong economy.
Stock Market Index Analysis
Technically, last week was another win for the bulls; the S&P 500 mustered a 1.1% gain for the five-day stretch. As far as victories go, though, it wasn't the quality win we were looking for.
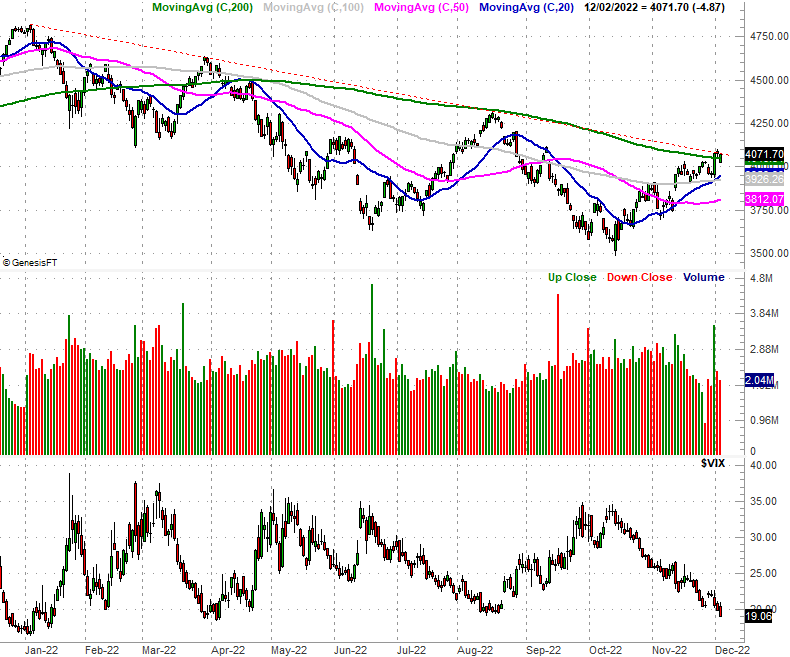
Take a look at the daily chart of the S&P 500 to see what we mean. The index managed to close above its 200-day moving average line (green) thanks to Friday's final bullish push, which had been something if a ceiling since April.
The index appears firmly stuck under the straight-line ceiling (red, dashed) that's been capping every rally since January's high. Until that hurdle is cleared, the market doesn't have nearly all the freedom it would ideally have to rally.
S&P 500 Daily Chart, with VIX and Volume
Source: TradeNavigator
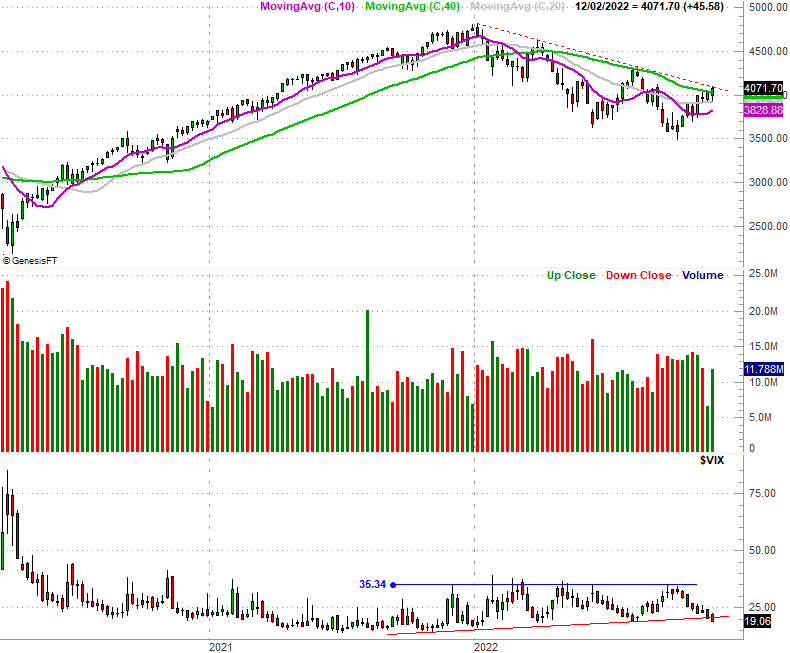
There is a bit more hope for the S&P 500 than it seems there is with the daily chart above, however. You just have to zoom out to the weekly chart to see it. From this vantage point we can see the S&P 500's Volatility Index (VIX) has finally broken under a support line that's been steering it higher since late last year.
S&P 500 Weekly Chart, with VIX and Volume
Source: TradeNavigator
That's not an ironclad signal of bullishness - not even close. In fact, as low as the VIX already is, any further downward travel brings it that much closer to an absolute low, pushing the S&P 500 itself closer to at least an intermediate-term peak. In that "the trend is your friend" until it clearly can't be your friend any longer though, the picture is more bullish than bearish.
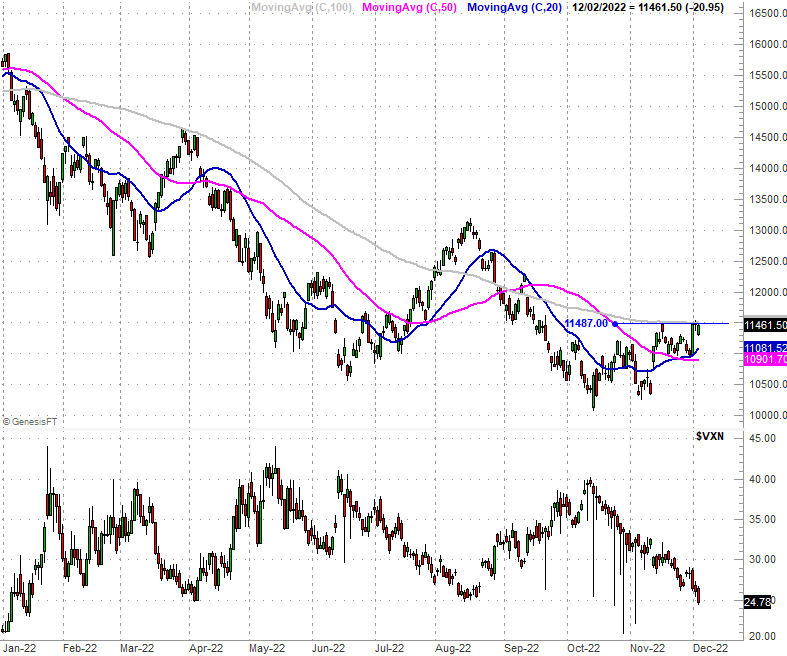
But, the Nasdaq Composite sure isn't making it easy to have that sort of confidence in stocks right now. Take a look. Like the S&P 500, the Nasdaq can't seem to get up and over its 100-day moving average line (gray) at 11,503 after testing it late last week as well as testing it in mid-November.
Indeed, it looks as if horizontal resistance is developing right around 11,500 (although one does have to appreciate the way the composite is pushing up and off of its 20-day moving average line (blue) at 11,080.
Nasdaq Composite Daily Chart, with VXN
Source: TradeNavigator
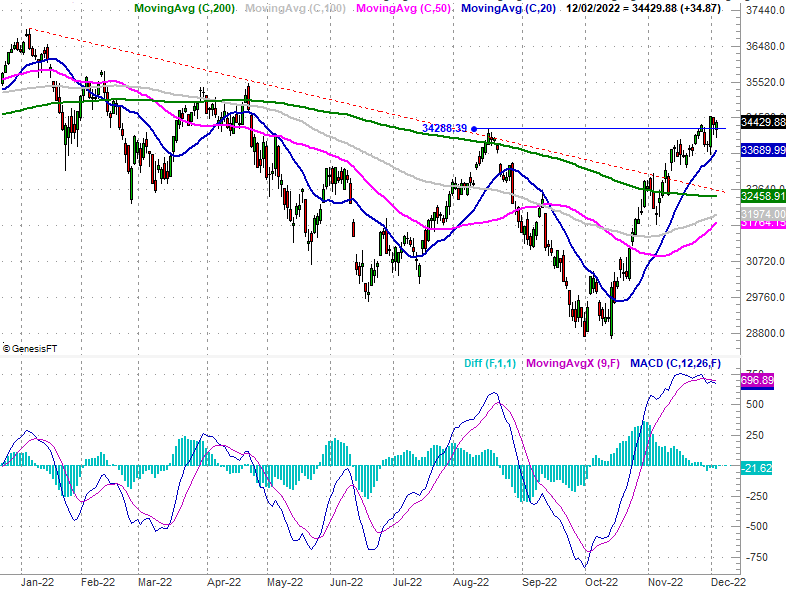
The only index that's showing us any real technical progress is the Dow Jones Industrial Average. It's managed to fight its way above its most recent peak, 34,288 from August, after hurdling an even-longer-term resistance level that had been holding the index down since January. Even so, the rally is clearly slowing down. We're already seeing a bearish MACD divergence.
Dow Jones Industrial Average Daily Chart, with Volume
Source: TradeNavigator
Again, the trend is bullish. The rally is still very vulnerable, though. Don't be in too much of a hurry to jump on board. The right move may be waiting to see how the market holds and responds to its next serious test.
More By This Author:
Stocks Are Oh-So-Close
Happy Fibonacci Day! Here's What You're Celebrating, And Why.
Despite the Dip, The Recovery Remains Intact


