Weekly Market Outlook – You Can’t Fight The Tape...Until You Can
Another week, another win. The broad market - as measured by the S&P 500 - rallied another 1.4% last week on the heels of a strong retail spending report for March, reaching a record high in the process. The Nasdaq didn't reach a new record, but logged a respectable 1.1% gain nonetheless. The Dow Jones blue chip index was up 1.2%, also hitting an all-time high
The advance is widespread and seemingly healthy, and looks like a trend worth plugging into if you haven't yet. There's also no denying that any bearish concerns or doubts about the rally's longevity of late have been debunked. Be careful though. Things that are too good to be true usually end up not being true, and we now have another reason to believe this market is near at least a short-term top.
We'll weigh it all below. First though, let's recap last week's big economic reports and preview this week's announcements. You likely already know the bullish figures, but the stuff you don't know is just as encouraging even if stocks as a whole are overextended here.
Economic Data Analysis
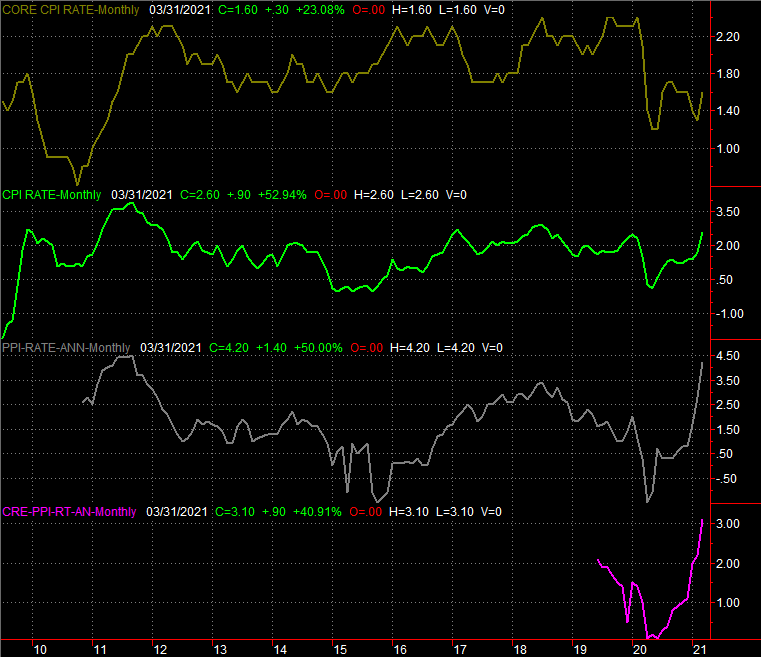
Two weeks ago we got a hint of unbridled inflationary pressure, when costs on the country's production facilities and factories jumped in March. That put all eyes on last week's consumer inflation figures, concerned that we were soon going to pay the price - literally -- for all the cheap money that's been printed over the course of the past year.
We're not, or at least not yet. While the overall inflation rate jumped to a multi-year high of 2.6%, rising food and energy prices are the culprit. Take them out of the mix and the annualized inflation rate is a more muted 1.6%.
Inflation Rate (Annualized) Charts
Source: Department of Labor, TradeStation
That doesn't mean we still can't see soaring prices in the foreseeable future, or that consumers aren't feeling the pain of more expensive groceries or gasoline. It's also not clear how much of that jump is linked solely to the one-year anniversary of the pandemic's arrival in the United States. For the time being though, there's no reason to panic.
That's especially the case in light of last month's retail spending figures. Consumers nearly upped their outlays by 10%, across all stratifications. Stimulus checks were a key driver.
Retail Spending Charts
Source: Census Bureau, TradeStation
It was a much-needed shot in the arm after February's consumerism contraction, although questions of longevity remain.
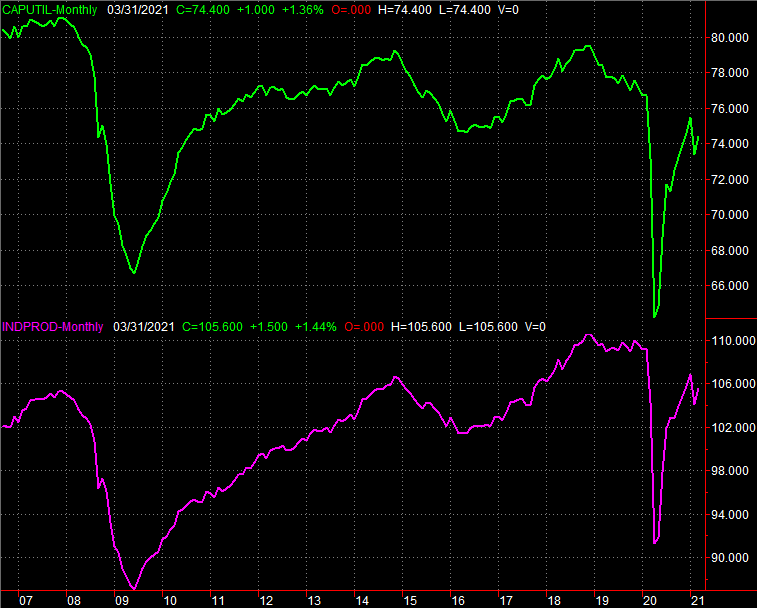
Those longevity questions are underscored by a slightly disappointing read on the nation's factory output and utilization. Capacity utilization improved from a revised 73.4% to 74.4%, but that's not the sort of growth economists were expecting -- particularly from factories that were hiring to meet the swell of demand linked by what was supposed to be an economic and employment rebound.
In this vein, industrial production's 1.4% growth was half what it was supposed to be, and may have been exaggerated by comparing it to February's even-bigger decline.
Capacity Utilization and Industrial Productivity Charts
Source: Federal Reserve, TradeStation
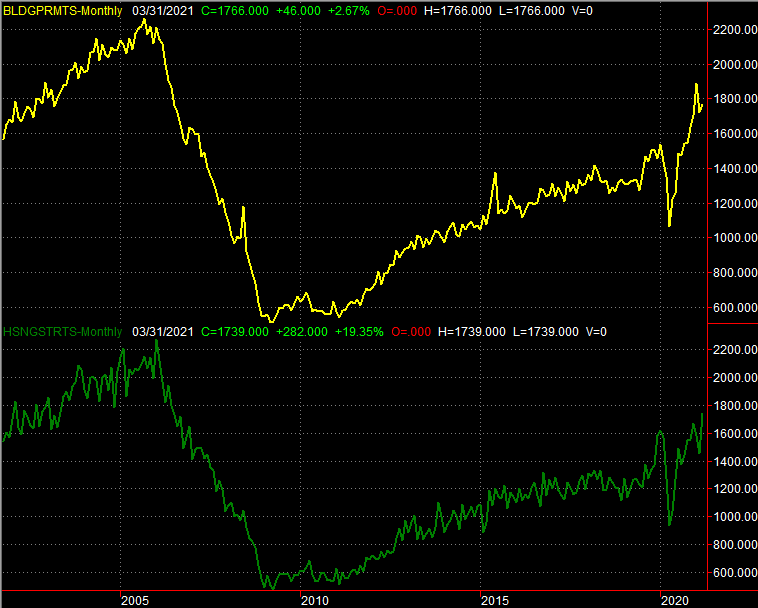
In other words, this is a sore spot. Whatever the economy's other problems, real estate seems to be a bright spot, with people on the hunt for new homes. Housing starts jumped to a multi-year high-pace of 1.739 million units, while permits were strong at 1.766 million -- near a recently-hit record.
Housing Starts, Building Permits Charts
Source: Census Bureau, TradeStation
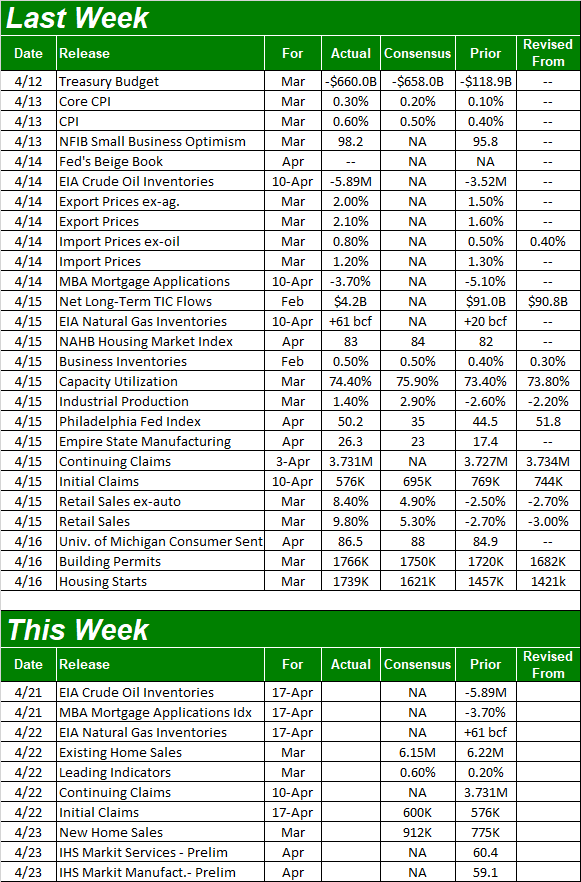
We'll round out the real estate picture this week with a look at actual sales of homes. Everything else is on the grid.
Economic Report Calendar
Source: Briefing.com
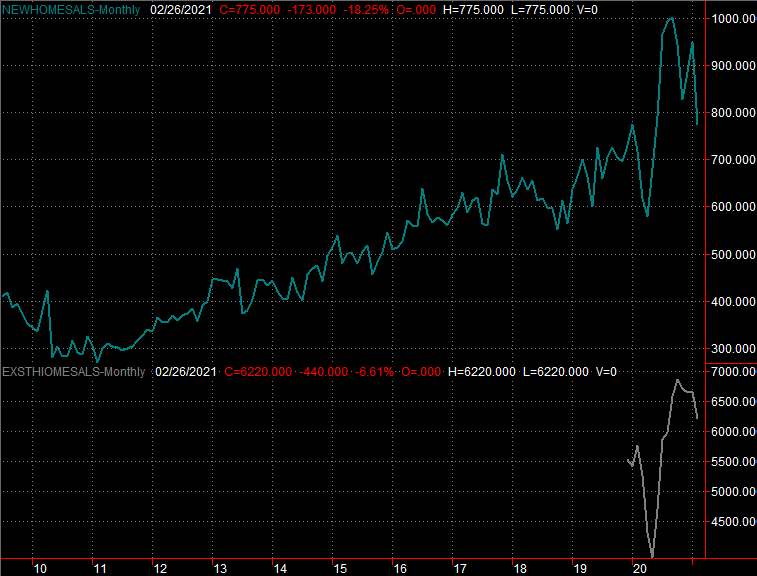
As was noted, we'll get home sales reports - new and existing - this week. That's all the economic data we care about that we're getting this week, however. We need both to be solid numbers after a couple of months' worth of declines, although bear in mind that a sheer lack of inventory is creating something of a bottleneck as well. That's something the ever-rising price indicators and huge starts and permits data confirms.
New, Existing Home Sales Charts
Source: Census Bureau, National Association of Realtors, TradeStation
Stock Market Index Analysis
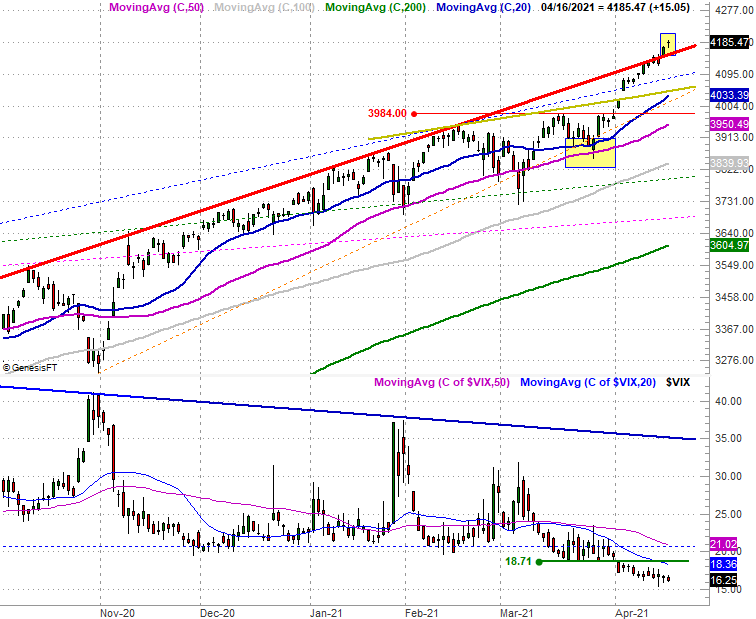
More unlikely gains were logged last week. You may recall that a week ago the S&P 500's rally was stalling at a technical resistance line (red, on our chart below) that connected all the key peaks going back to October. The advance since pushing up and off of the 50-day moving average line (purple) late last month is a 7.8% romp. This is decidedly-bullish momentum built on a reasonably-strong foundation.
S&P 500 Daily Chart, with VIX
Source: TradeNavigator
There are problems with this momentum though, particularly given this context. Namely, the market's overextended and ripe for a pullback, and we're seeing clues that one could be near.
See the shape of Friday's bar? It's a doji, where the open and close are not only virtually the same, but in the middle of the low-to-high range. This is a subtle sign that transitional equilibrium has been met, meaning the point where net-bullishness is about to pivot to net-bearishness (or vice versa) is here. That fact that the VIX is so low is another red flag, although the longer-term daily chart of the S&P 500 (below) puts this in a better perspective.
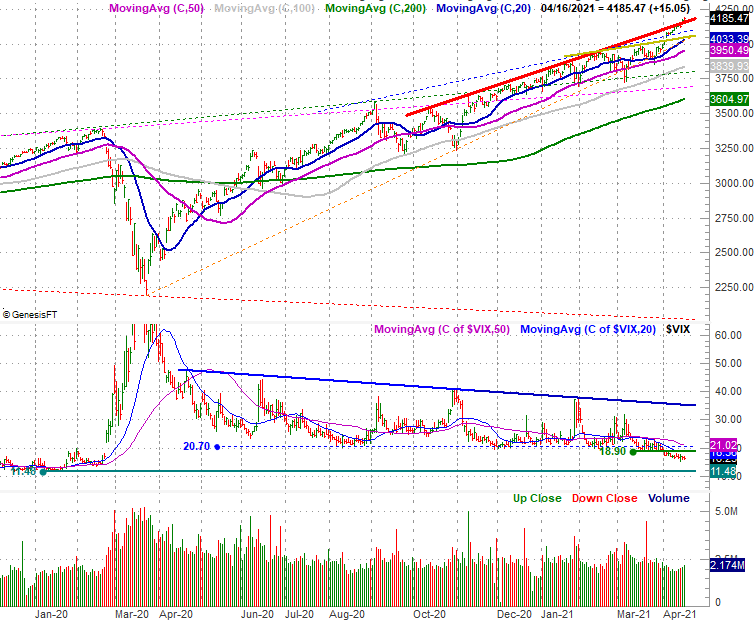
S&P 500 Daily Chart, with VIX and Volume
Source: TradeNavigator
This view shows us the incredible 91% advance from last March's low, which has been a fun ride, but has arguably been too much. As of Friday the index lies 16.1% above its 200-day moving average line, which is - historically speaking - an unusual degree of divergence that's tough to sustain. This bigger-picture look also shows us how close to an absolute floor near 11.5 the VIX currently is, now that it's broken below a floor (blue, dashed) near 20.0.
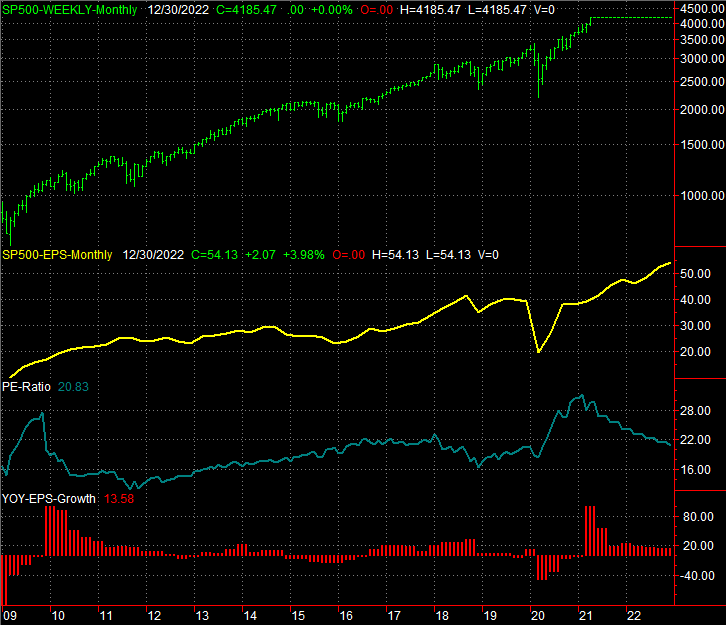
There's another problem for the broad market, using the S&P 500 as our proxy. It's overvalued. As of the latest look based on Q1's estimated earnings, the index is trading at a trailing twelve-month P/E of just under 28.0.
S&P 500 Weekly Chart, with EPS, P/E Ratio (past and projected), and Growth Rate
Source: TradeStation
Yes, the "trailing" includes a tough second quarter of last year, when the world was still figuring out how to cope with COVID-19. Earnings are still recovering too, and perhaps more so than usual, traders should focus on the future and not the past. Even by those standards though, valuations are rich.
The S&P 500 is presently priced at 23.2 times earnings for the next for quarters, and 21.0 times 2022's projected profits. Both are also above long-term norms, even though by the end of 2022 the adverse impact of the coronavirus contagion should be completely out of the way.
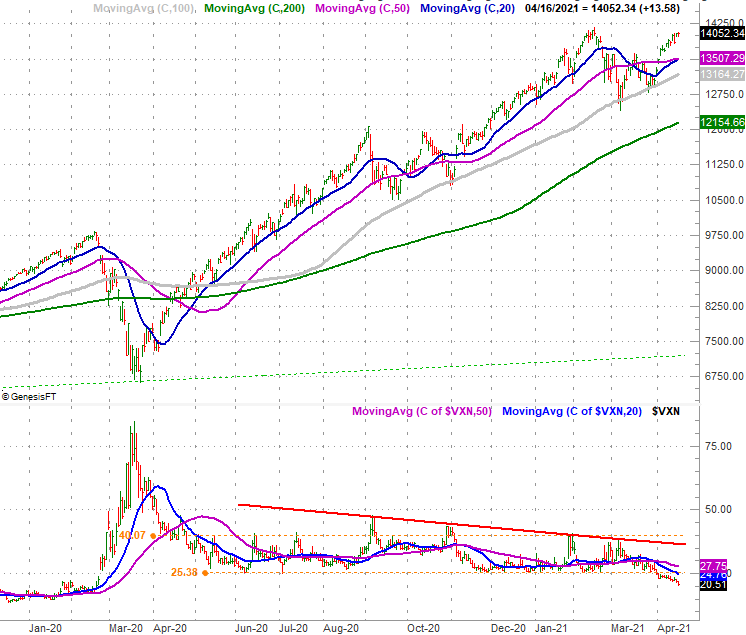
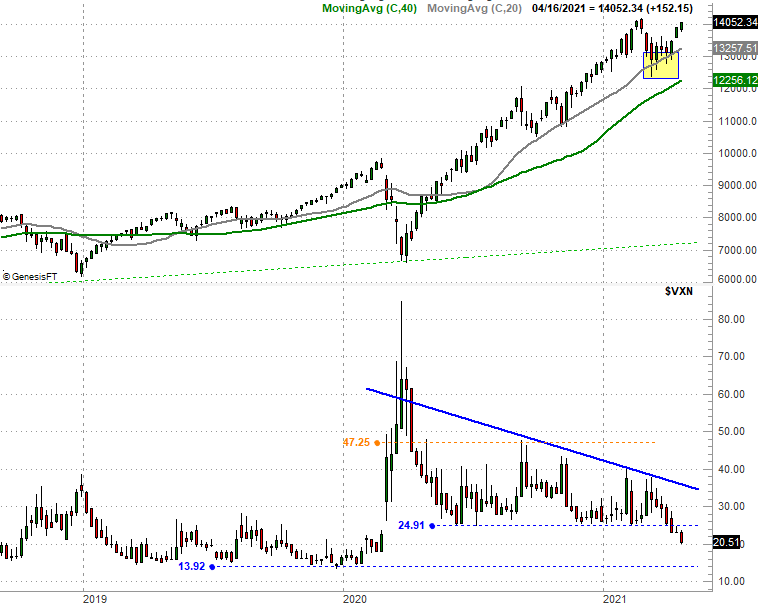
The S&P 500 isn't the only index waving red flags though. While the Nasdaq Composite logged a 1.1% gain, each day's gain was weaker than the prior day's gain. The arching nature of the recent daily highs says the advance is losing steam, and like the S&P 500's Volatility Index, the Nasdaq's Volatility Index (VXN) looks bullish by virtue of its move below the floor at 25.4 (orange, dashed). But, it's alarmingly near its more absolute floor around 14.0.
Nasdaq Composite Daily Chart, with VXN
Source: TradeNavigator
You can also just tell with a passing glance at the daily Nasdaq chart that its momentum has been slowing since the middle of last year. The composite currently lies just 15.6% above its 200-day moving average line (green), which is a big divergence, but not as big as the 25% divergence seen in mid-February.
Here's the weekly chart of the Nasdaq, just for added perspective. Overbought or not, you have to like the way the composited pushed up and off of the 100-day moving average line (gray) a month ago (highlighted).
Nasdaq Composite Weekly Chart, with VXN
Source: TradeNavigator
Don't read too much into last week's action, bullish or bearish. Friday was an option expiration day, which can skew stocks, and certainly skews the volatility indices. Regardless, we're starting this week out where we ended last week. That's overbought and vulnerable to some selling.
Just because we're due, however, doesn't mean it's going to happen. Until any weakness actually breaks the index's key support lines - and the 100-day moving average lines in particular - the bulls need not sweat.

