

Image source: Pixabay
For the second week in a row, stocks suffered losses. And this time around, the market was dragged all the way to the brink of implosion, but not past it. It’s close, though. It’s so close, in fact, that one more bad day could do the trick and push the indexes below key technical floors. We’re not there yet, however. We’re just uncomfortably close.
We’ll see how closer we are to the brink in just a moment. Let’s first look at last week’s most important economic news and then preview what’s due this week. Spoiler alert: It’s getting tougher for the Federal Reserve to say it’s planning on imposing a handful of interest rate cuts in the foreseeable future.
Economic Data Analysis
There was only one set of data released last week, but it’s a big one. We heard March’s inflation numbers. Consumer inflation was posted on Wednesday, while producer inflation figures were released on Thursday. Core rates (excluding fuel and food) are mostly flat -- and flattening at above-target levels -- while overall inflation rates are clearly starting to edge higher again. Interest rate cuts would only exacerbate this nagging problem, of course.
Inflation Rate Charts
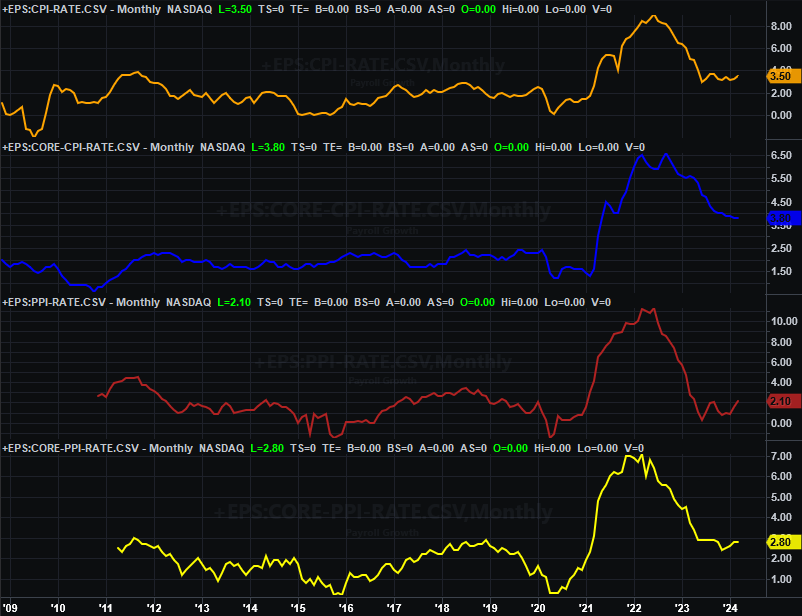
(Click on image to enlarge)
Source: Bureau of Labor Statistics TradeStation
Everything is on the grid.
Economic Calendar
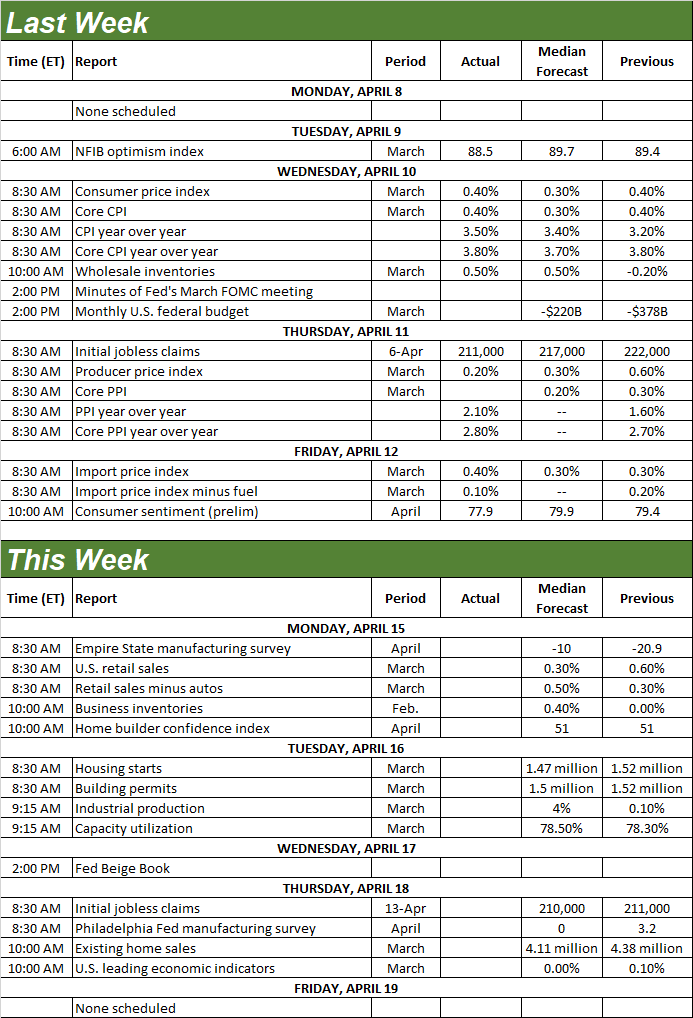
(Click on image to enlarge)
Source: Briefing.com
This week’s going to be a pretty big one, particularly for real estate. The party starts, however, with Monday’s look at March’s retail sales. Retail spending has been broadly slowing down, and will likely continue doing so.
Retail Sales Charts
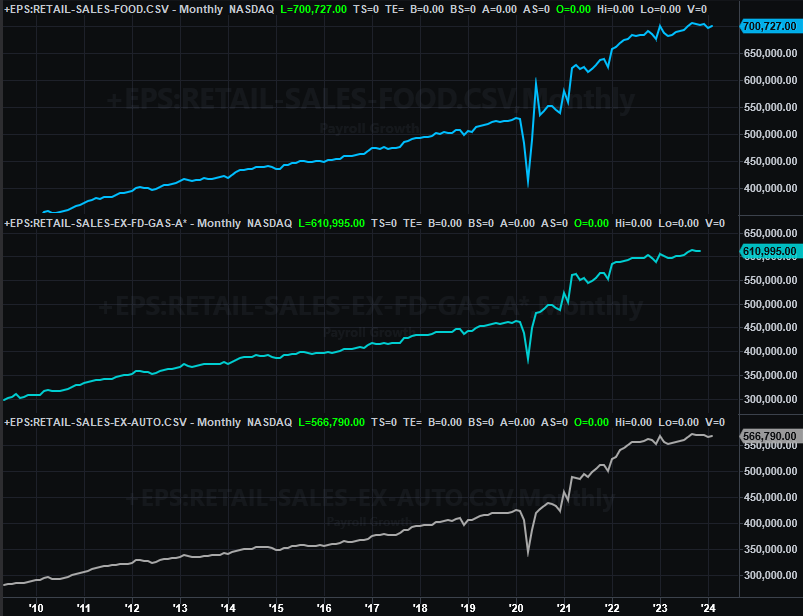
(Click on image to enlarge)
Source: Census Bureau, TradeStation
Note that also on Monday, we’ll get April’s Homebuilder Confidence Index. It’s been healthy of late, and while the rate of rebound should come to a screeching halt, it’s halting at reasonably-healthy levels.
The homebuilder sentiment score, however, precedes Tuesday’s look at housing starts and building permits (which, of course, are related to the Homebuilder Confidence Index). We should see a slight slowdown this time around, but not enough of a slowdown to alter the current, shallow recovery that’s trying to take hold.
Housing Starts and Building Permits Charts
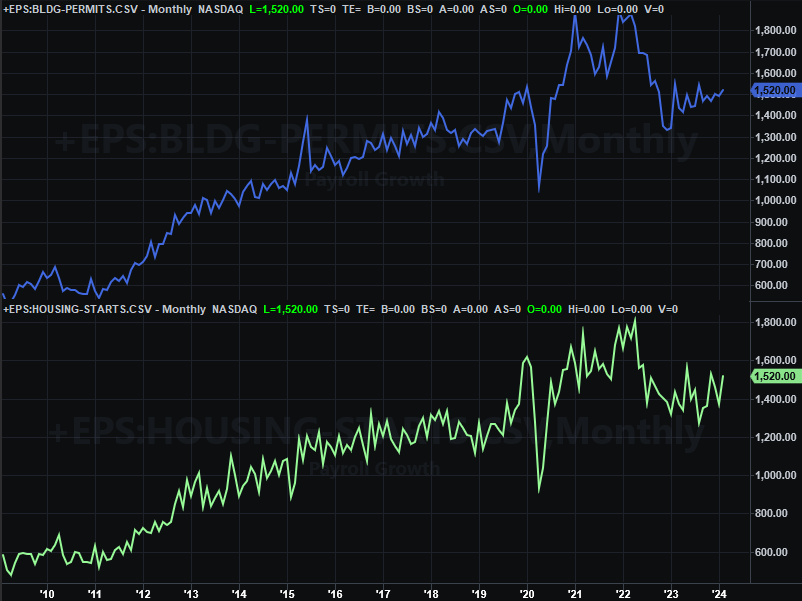
(Click on image to enlarge)
Source: Census Bureau, TradeStation
Also on Tuesday, we’ll hear last month’s capacity utilization and industrial productivity numbers from the Federal Reserve. Both have been deteriorating alarmingly for many months now. Economists are calling for a slight uptick in both numbers again, but it’s not enough to change the bigger downtrends.
Capacity Utilization and Industrial Productivity Charts
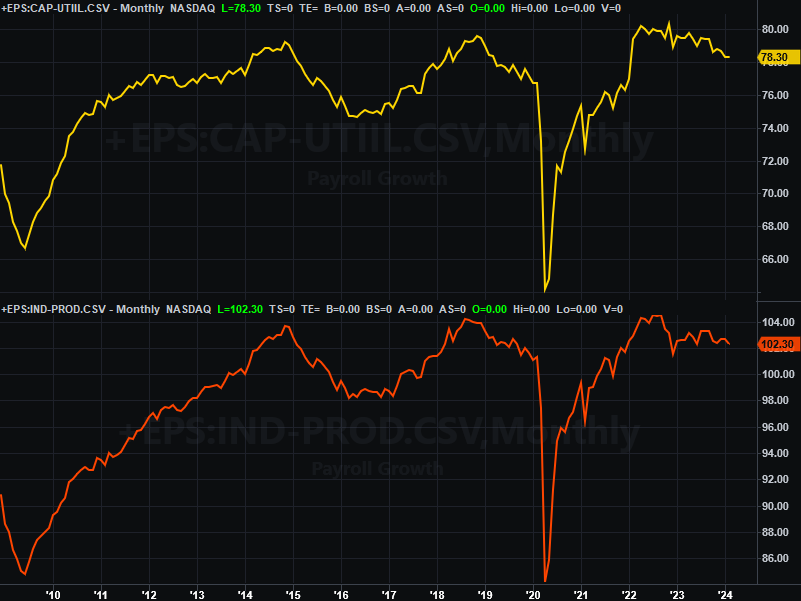
(Click on image to enlarge)
Source: Federal Reserve, TradeStation
Finally, on Friday, we’ll get March’s existing home sales report. They’ve been rolling higher for a while now, but forecasters say the rebound is going to hit a slight wall here. It’s still too soon to presume the worst, however.
New and Existing Home Sales Charts
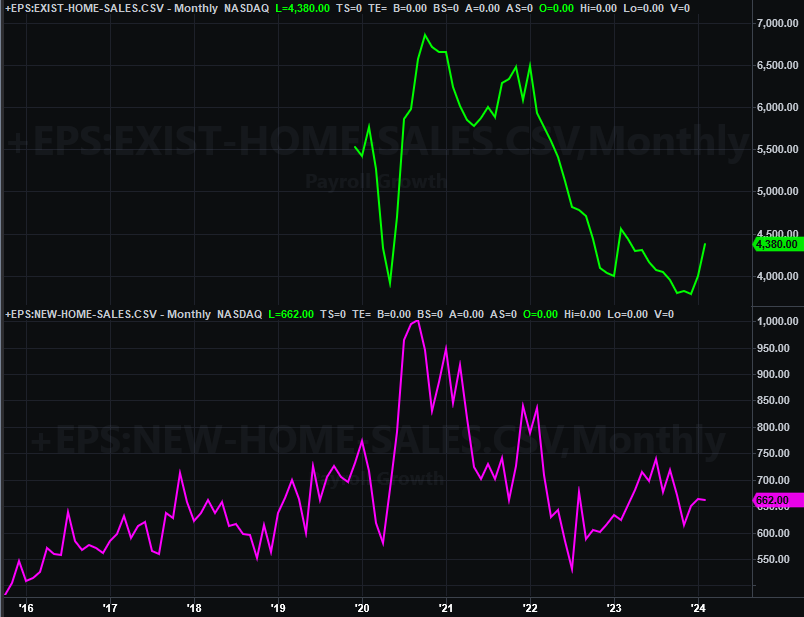
(Click on image to enlarge)
Source: Federal Reserve, TradeStation
The new-home sales data for last month will be released next week, rounding out this slate of real estate sales information. Unlike existing-home sales figures, new-home sales have remained anemic (if only because builders were a bit afraid to build a new home on spec; would-be buyers may be a little hesitant to commit to more-expensive new houses anyway). It’ll be interesting to see if sales actually follow homebuilder sentiment and starts/permits figures higher.
Stock Market Index Analysis
Both of the major market indices suffered a serious technical blow two weeks ago. That damage was worsened last week. Former support levels seem to be resistance lines now.
Take the S&P 500 as an example. It fell below the 20-day moving average line (royal blue) two weeks ago (albeit briefly). It fell back under that line last week, and the effort to crawl back above it on Thursday ultimately failed once it was touched. The index was most definitely moving the other direction the next day -- Friday -- to make its lowest close since early March. With that tumble, the S&P 500 is now priced 2.6% below its late-March peak.
S&P 500 Daily Chart, with VIX and Volume
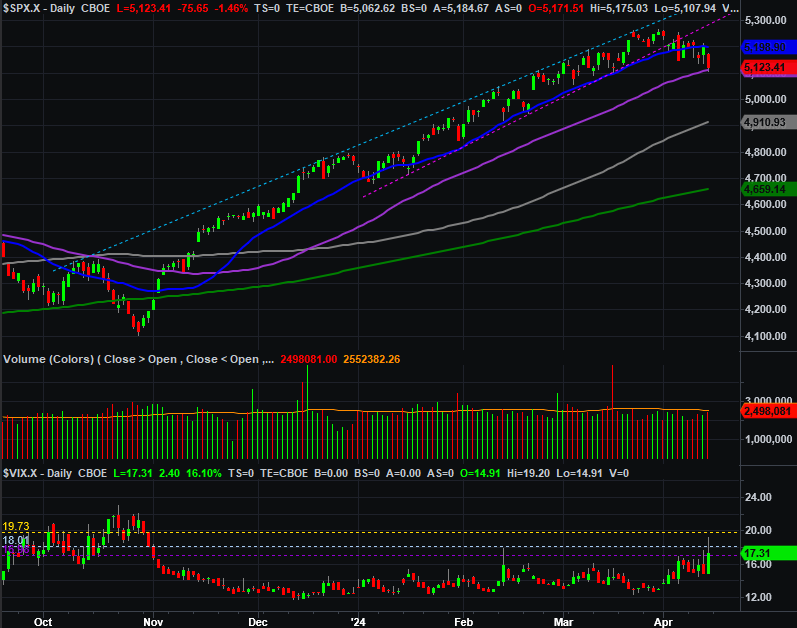
(Click on image to enlarge)
Source: TradeNavigator
And yet, the S&P 500 clearly remains above an even-more-pivotal moving average line, finding support at it on Friday. That’s the 50-day moving average line (purple) at 5,111. All it took was a touch of that line on Friday to stop the bleeding.
The daily chart of the Nasdaq Composite is in similar shape. That is, the composite is no longer finding support at its 20-day moving average line, nor is it finding support at its straight-line support that had been steering it higher since January (light blue, dashed). Also like the S&P 500, however, the Nasdaq is still holding above its 50-day moving average line (purple) at 16,072 -- although it certainly is testing that floor.
Nasdaq Composite Daily Chart, with VXN and Volume
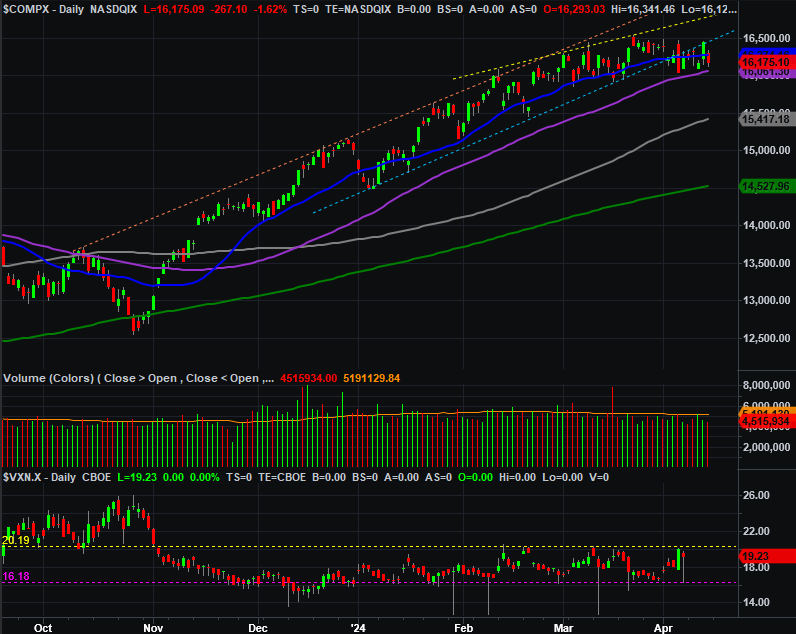
(Click on image to enlarge)
Source: TradeNavigator
There’s something else that’s readily evident on the Nasdaq Composite’s chart, however, that should worry the bulls (even if stocks have yet to be dealt a decisive death blow). That’s the way the Nasdaq’s Volatility Index (or VXN) is acting. It’s knocking on the door of breaking above an established technical ceiling at 20.2.
This is a repeated attack on that resistance line too, and now it’s coinciding with an attack on the support the Nasdaq Composite itself is finding at its 50-day line. If both of these lines are breached at the same time, it may well be a sign that the proverbial bearish flood gates have opened. They won’t likely be closed again until any correction has run its full course.
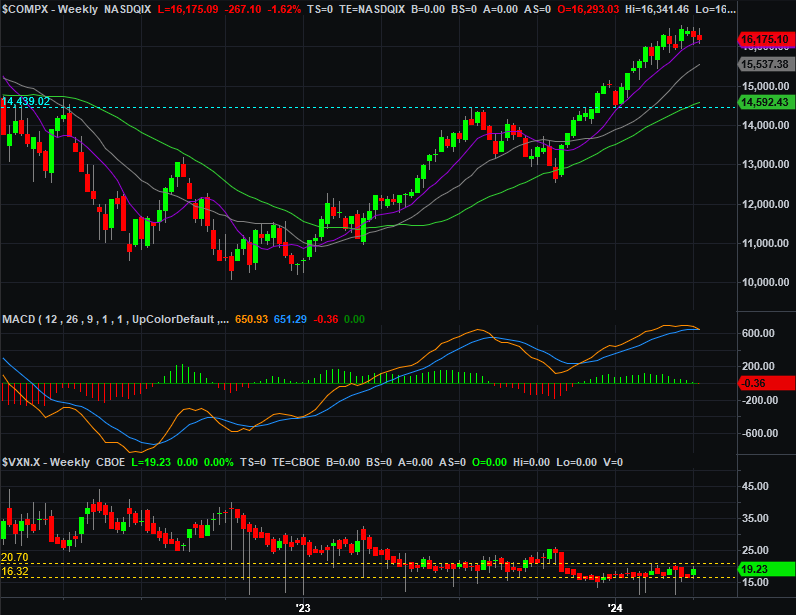
The weekly chart of the Nasdaq Composite puts this whole dynamic in perspective. The runup from October’s low is huge -- so huge that it’s begging for profit-taking now. The weekly chart also reminds us how long the VXN has been so low. It too is ripe for a reversal that would work against stocks.
Perhaps most problematic with the weekly chart, however, is that the Nasdaq’s MACD lines have just made a bearish divergence. The last time we saw this happen was in August of last year, preceding a pretty big correction.
Nasdaq Composite Weekly Chart, with VXN and Volume
(Click on image to enlarge)
Source: TradeNavigator
The stage is certainly set for some serious downside. Just bear in mind the most important triggers of such a selloff have yet to materialize. And, they might not. It’s entirely possible the market could end up pushing up and off its 50-day moving average lines -- possible, but decreasingly likely given the way things are shaping up right now.
More By This Author:
Weekly Market Outlook – Cracks Are Starting To Show, But The Rally Remains IntactWeekly Market Outlook – Just Chuggin’ Along
Weekly Market Outlook – The Rally’s Renewal Is 0% Surprising

Comments
Log in or sign up to join the conversation.