

Image Source: Pexels
Following through on the prior week’s rebound, stocks (mostly) made more progress last week despite it being shortened by the holiday. The longer-term uptrend is still alive and well. Ergo, we remain bullish. Also know that April and May are -- on average -- firmly bullish more often than not. There’s decent reason to believe more upside is possible.
And, as was also the case last week, the market’s technical support levels are clear, and strong. If-and-when something starts to break, it will be obvious.
We’ll look at this action in detail in a moment. Let’s first review last week’s most important economic news, and preview what’s coming news-wise this week.
Economic Data Analysis
We rounded out the previous week’s wave of housing market news with some more real estate data. You may recall that building permits and housing starts were up be a healthier amount, and that sales of existing homes were really robust in February. But, that’s the end of the impressiveness. New-home sales faded a bit last month, and were already at anemic levels.
New, Existing Home Sales Charts
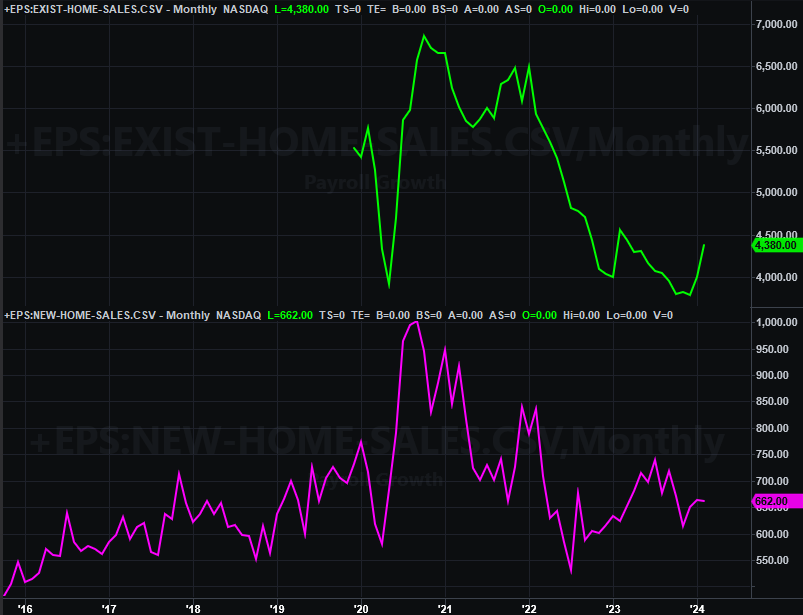
(Click on image to enlarge)
Source: Census Bureau, National Assn. of Realtors TradeStation
And, home prices have continued to level off, if not outright cooling. The FHFA Home Price Index fell just a bit in January, while the Case-Shiller index has now fallen for four straight months.
Home Price Index Charts
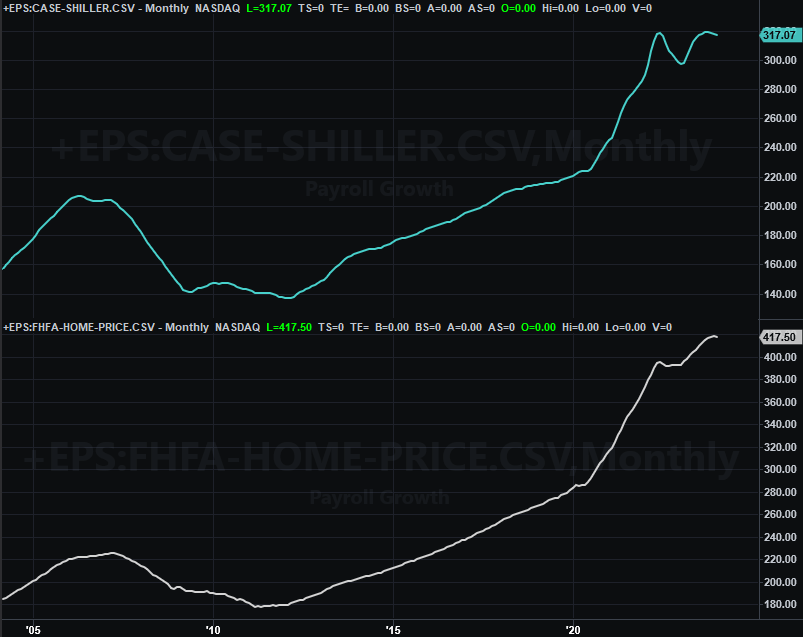
(Click on image to enlarge)
Source: FHFA, Standard & Poor’s, TradeStation
As we discussed last week, these waning prices may not be a bad thing altogether. They’ve become very frothy, so much so that people aren’t buying. Better prices may spur more transactions. But, it’s too soon to say a healthy balance has been found.
Underscoring this worry is the fact that consumer sentiment is still far from rock-solid. The Conference Board’s score remains tepid, while the University of Michigan’s reading peeled back just a bit following February’s surprise surge.
Consumer Sentiment Charts
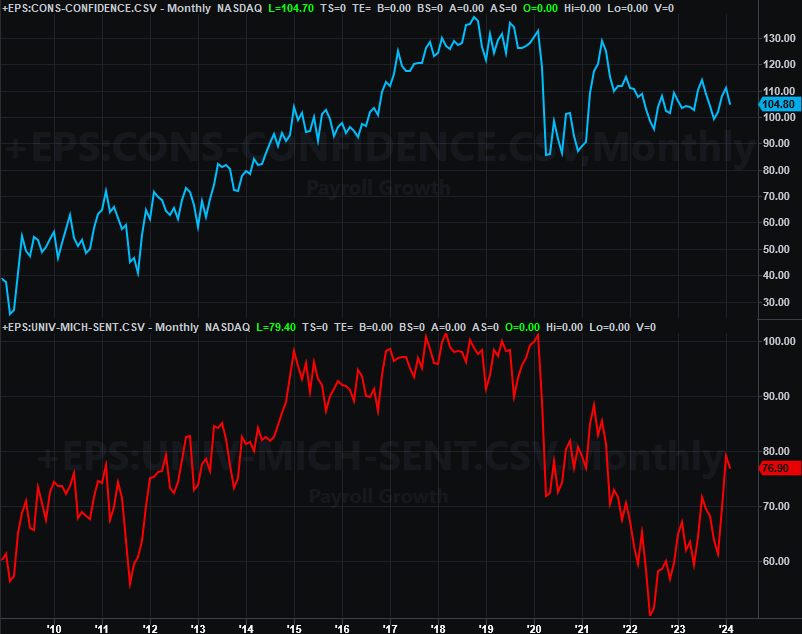
(Click on image to enlarge)
Source: University of Michigan, Conference Board, TradeStation
Everything is on the grid.
Economic Calendar
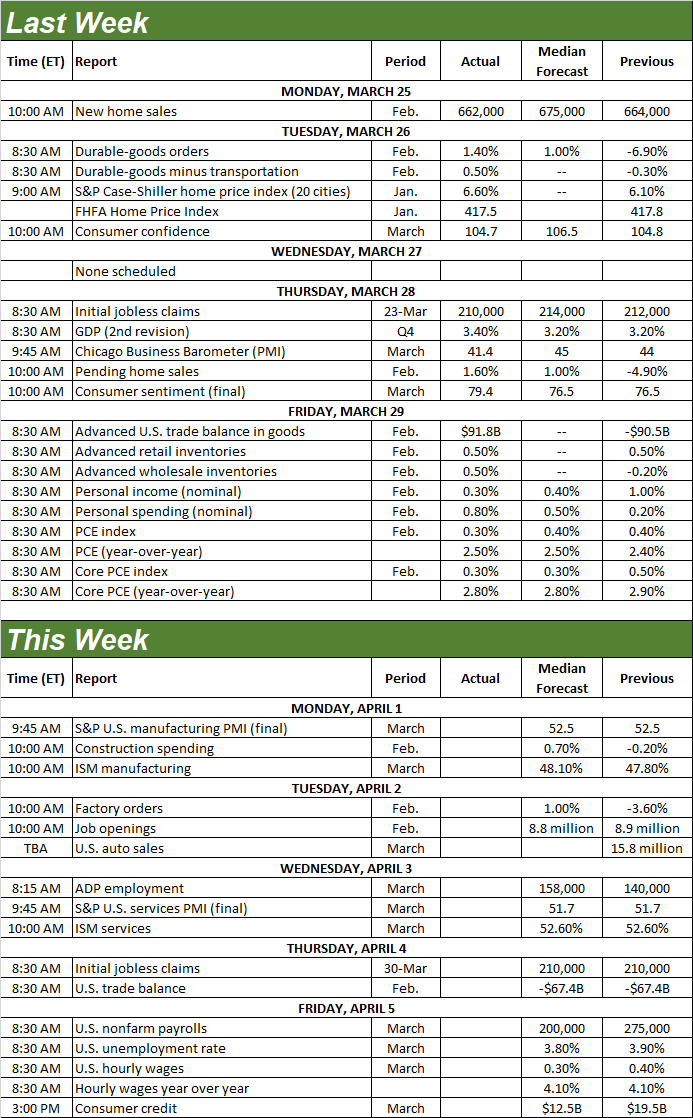
(Click on image to enlarge)
Source: Briefing.com
We’ve only got a couple of sets of reports worth noting this week.
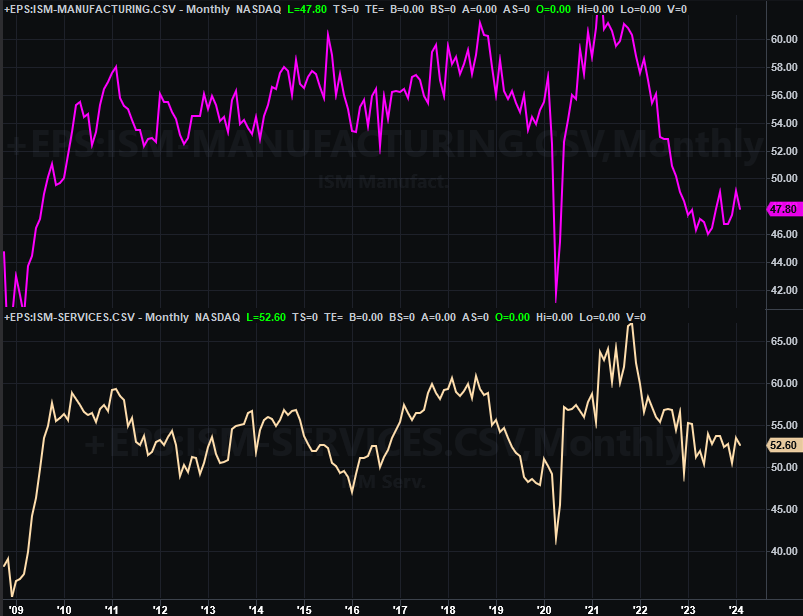
The first of these is the Institute of Supply Management’s measure of economic activity. The manufacturing figure is coming in Monday, with the services data due on Wednesday. As the chart below shows, both have been trying to recover from last year’s lull. Economists think, at the very least, we’ll see these numbers not get any worse.
ISM Services and Manufacturing Index Charts
(Click on image to enlarge)
Source: Institute of Supply Management, TradeStation
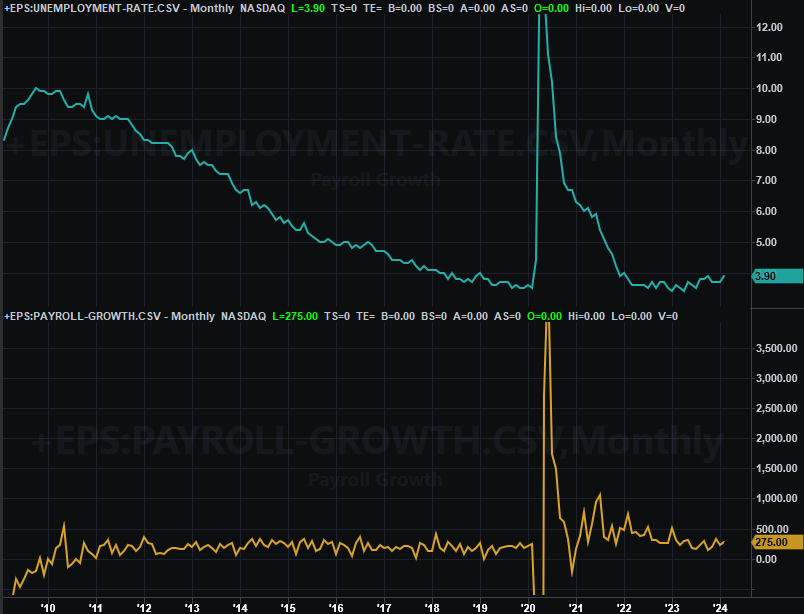
Then, on Friday, look for February’s jobs report. Forecasters believe February’s unemployment rate of 3.9% will slide to 3.8%, but that’s progress with a big footnote. Payroll growth should also cool from a pace of 275,000 to 200,000 in March.
Unemployment Rate and Payroll Growth Charts
(Click on image to enlarge)
Source: Bureau of Labor Statistics, TradeStation
No matter how you slice it, the jobs market isn’t quite as robust as it was just a few months ago.
Stock Market Index Analysis
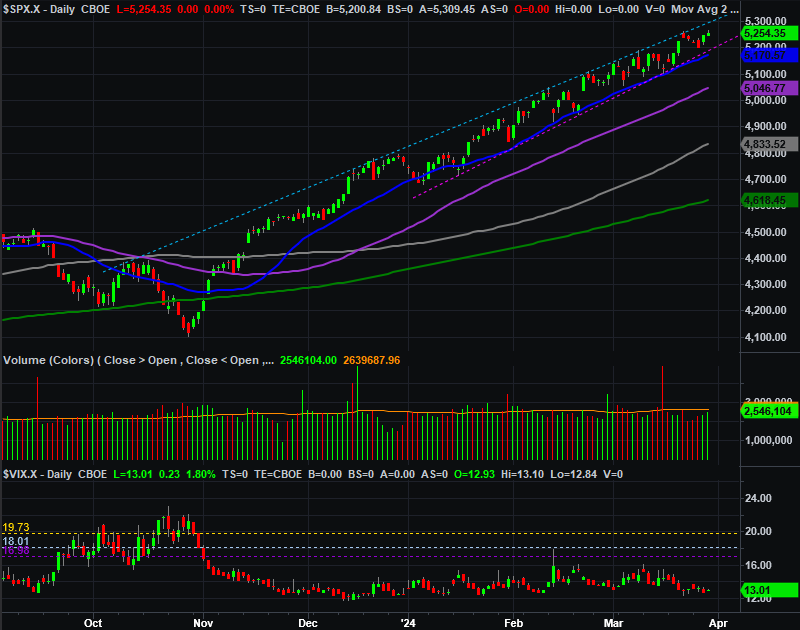
We kick things off this week with a distant look at the daily chart of the S&P 500, largely to show you the entirety of the well-framed rally that’s been underway since October. The upper boundary (blue, dashed) of the trading range has been in place since December, while the lower boundary (red, dashed) has been in place since January.
S&P 500 Daily Chart, with VIX and Volume
(Click on image to enlarge)
Source: TradeNavigator
These two guardrails are mostly parallel, as well as close together. That’s good in the sense that the week-to-week gains are pretty consistent, and the index never has a chance to over-accelerate or get a running start at a breakdown. The index could -- in theory, anyway -- last another month or two at this current pace before the technical floor and ceiling converge and leave the S&P 500 no room at all to continue maneuvering.
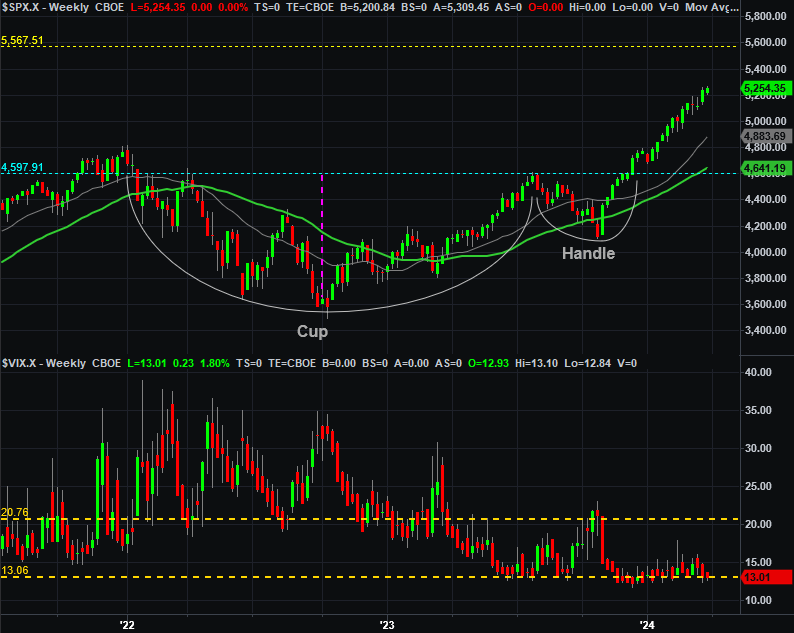
And, that would jibe with the fact that April and May are -- on average -- pretty good months for the market (April’s is 1.5%, and May’s is 1.0%). Moreover, there’s still time and room for the index to complete its cup-and-handle breakout that first took shape in December. This move could go all the way up to the 5,600 area before running out of steam, as the weekly chart indicates below.
S&P 500 Weekly Chart, with VIX and Volume
(Click on image to enlarge)
Source: TradeNavigator
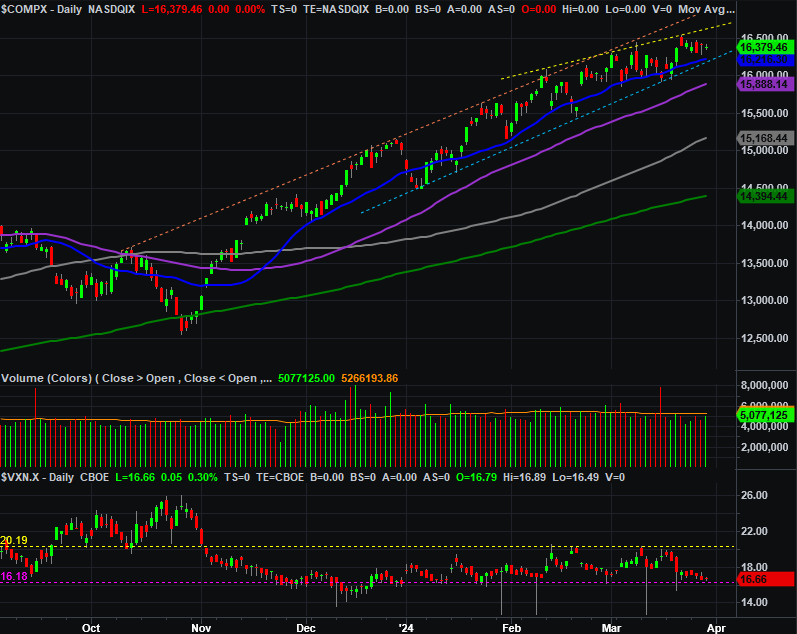
The Nasdaq Composite is in a similar situation, but with one noteworthy difference. That is, the rising resistance line that’s connected all the key highs since October is no longer being tested. A new, shallower technical ceiling (yellow, dashed) has materialized, beginning in February.
This line is going to converge with the Nasdaq’s rising support line (light blue, dashed) in just a few weeks, forcing the composite to make a move/decision sooner than the S&P 500 will have to.
Nasdaq Composite Daily Chart, with VXN and Volume
(Click on image to enlarge)
Source: TradeNavigator
On that note, the Nasdaq Composite’s shallower technical ceiling may be a hint that its rally is indeed slowing down -- a problem simply because the Nasdaq leads the market higher and lower. If it’s weak, it may only be a matter of time before it starts to crack.
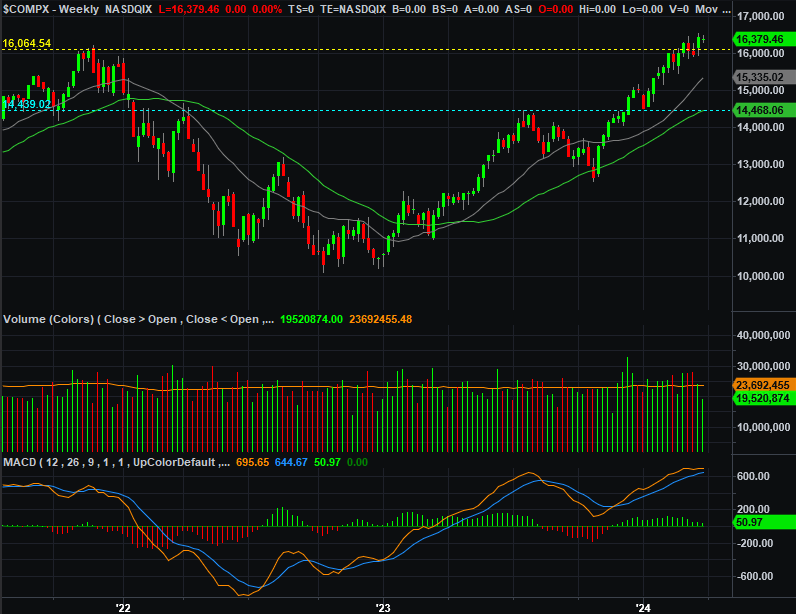
If we see it break under that long-term support line at the same time we see the weekly chart of the Nasdaq (below) dish out a bearish MACD cross-under/divergence, that’s too big of a red flag to ignore.
Nasdaq Composite Weekly Chart, with VXN and Volume
(Click on image to enlarge)
Source: TradeNavigator
Nevertheless, the trend right now is bullish, and both of the indexes are above their most important technical support levels. Don’t overthink things here.
More By This Author:
Weekly Market Outlook – The Rally’s Renewal Is 0% SurprisingWeekly Market Outlook – Small Cracks Showing, But Don’t Panic Yet
Weekly Market Outlook – Friday’s Pullback Was Scripted, And Not Yet A Cause For Concern

Comments
Log in or sign up to join the conversation.