
Weekly indicators from Lewis-Mertens-Stock (NY Fed) Weekly Economic Indicators, and Baumeister, Leiva-Leon and Sims WECIand Woloszko (OECD) Weekly Tracker through 12/17, released today.
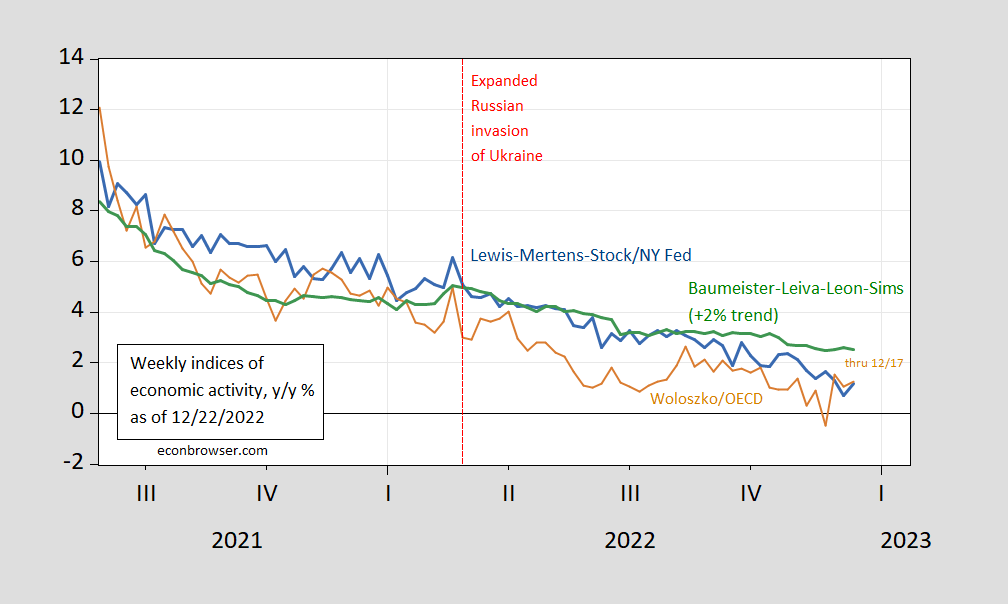
Figure 1: Lewis-Mertens-Stock Weekly Economic Index (blue), OECD Weekly Tracker (tan), Baumeister-Leiva-Leon-Sims Weekly Economic Conditions Index for US plus 2% trend (green). Source: NY Fed via FRED, OECD, WECI, and author’s calculations.
The deceleration has been pretty consistent over time, and across indicators, with the exception of the Weekly Tracker, which dipped into negative for the week ending 11/26, before rebounding to match the WEI. The WEI reading for the week ending 12/17 of 1.2% is interpretable as a y/y quarter growth of 1.2% if the 1.2% reading were to persist for an entire quarter. The OECD Weekly Tracker reading of 1.3% is interpretable as a y/y growth rate of 1.3% for year ending 12/17. The Baumeister et al. reading of 0.5% is interpreted as a 0.5% growth rate in excess of long term trend growth rate. Average growth of US GDP over the 2000-19 period is about 2%, so this implies a 2.5% growth rate for the year ending 12/17.
Q4 GDPNow as of 12/20 was 2.7% q/q SAAR. There’ll be new release tomorrow.
More By This Author:
Yet More On Adjusting The CES, Private Nonfarm PayrollMore On Adjusting The CES
Business Cycle Indicators, Mid-December


Comments
Log in or sign up to join the conversation.