Weekly Forex Forecast - Sunday, May 25
Image Source: Unsplash
Fundamental Analysis & Market Sentiment
I previously wrote on Sunday, May 18, 2025 that the best trades for the week would be the following:
- Long of the Nasdaq 100 Index following a daily (New York) close above 22,161. This did not set up.
- Long of the S&P 500 Index following a daily (New York) close above 6,142. This did not set up.
- Long of Bitcoin following a daily (New York) close above $106,187. This set up last Tuesday and produced a win of 0.70%.
- Short of the USD/ZAR currency pair following a daily (New York) close below 17.98. This set up last Tuesday and produced a win of 0.83%.
The overall win of 1.53% equals a win of 0.38% per asset.
Meanwhile, last week saw market sentiment move into a more risk-off zone, due to two major factors:
- President Trump’s tax bill looks like it is failing, as Congress wants to water it down in a way that would severely reduce the expenditure reductions which Trump wanted. Republicans have only a narrow majority in the House of Representatives, so Trump is not in such a strong position here to force through everything he wants into the bill. This makes analysts less optimistic about debt reduction.
- After weeks of only happy noises emanating from the “trade war” which has been kicked into the sidelines, the July deadline begins to approach, and last week saw Trump going back to making quite aggressive statements. This time the EU was on the receiving end, with President Trump saying they are not negotiating in good faith, and suggesting a 50% tariff on all imports could be imposed within a week.
Last week’s most important data releases were the following:
- UK CPI (inflation) – this came in considerably higher than expected, at 3.5% annualized.
- RBA Cash Rate & Rate Statement – interest rates were cut by 0.25% as expected, and the language on inflation was just a touch hawkish.
- Canada CPI (inflation) – some of the data was a bit higher than expected.
- USA, Germany, UK, France Flash Services / Manufacturing PMI – US data was good, while the rest was not.
- UK Retail Sales – this came in better than expected.
- Canada Retail Sales – this came in better than expected.
- US Unemployment Claims – this was almost exactly as expected.
The Week Ahead: May 26-31, 2025
The coming week has what will probably turn out to be a more important schedule of high-impact data releases. The week’s important data points, in order of likely significance, are as follows:
- US Core PCE Price Index
- US FOMC Meeting Minutes
- US Preliminary GDP
- German Preliminary CPI (inflation)
- Australian CPI (inflation)
- RBNZ Official Cash Rate, Rate Statement, and Policy Statement
- US Unemployment Claims
The most impactful events on the Forex market will likely be the RBA policy meeting, followed by the two items of inflation data.
Monthly Forecast for May 2025
(Click on image to enlarge)
For the month of May 2025, I did not provide a monthly forecast. Although there was a long-term trend against the US dollar, the price action suggested that a major bullish reversal could be underway.
Weekly Forecast for Sunday, May 25, 2025
As there were no unusually large price movements in Forex currency crosses over the past week, I will not provide a weekly forecast.
The Canadian dollar was the strongest major currency last week, while the US dollar was the weakest. Volatility increased over this period, as 26% of the most important Forex currency pairs and crosses changed in value by more than 1%. Next week’s volatility is likely to remain at a similar level.
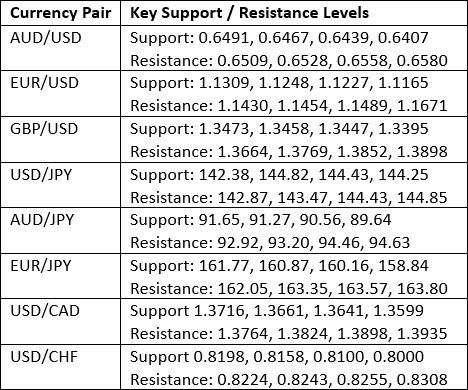
Key Support/Resistance Levels for Popular Pairs
Technical Analysis - US Dollar Index
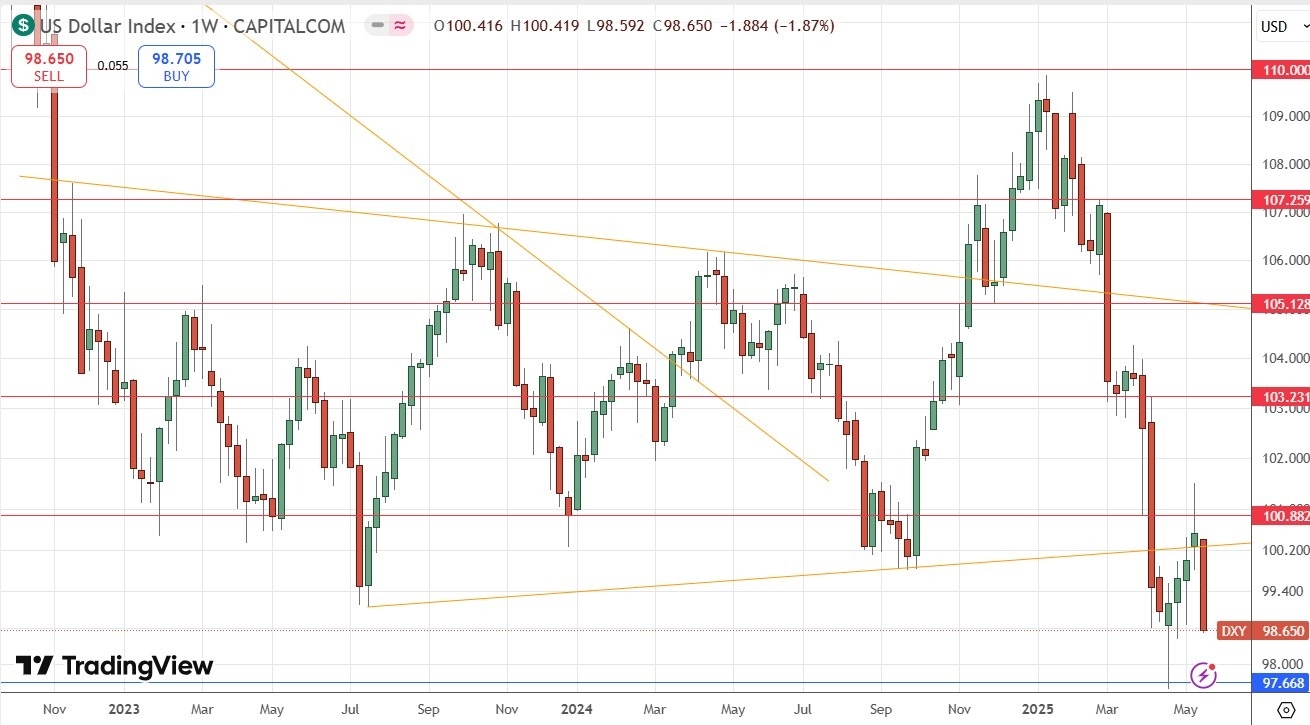
Last week, the US Dollar Index printed a large bearish candlestick which closed right on its low. The weekly closing price was the lowest since March 2022. These are very bearish signs and suggest that we are seeing momentum in the direction of the long-term bearish trend.
The bullish case is represented by the fact that the price has not yet broken the multi-year low. In this area at the low, we have a horizontal level which has already proved to be strong support, at 97.67.
I think it makes sense to be trading in line with the long-term trend which would be short of the greenback. If there is short-term bearish momentum when the price opens this week, you could be more confident in going short here.
(Click on image to enlarge)
The S&P 500 Index
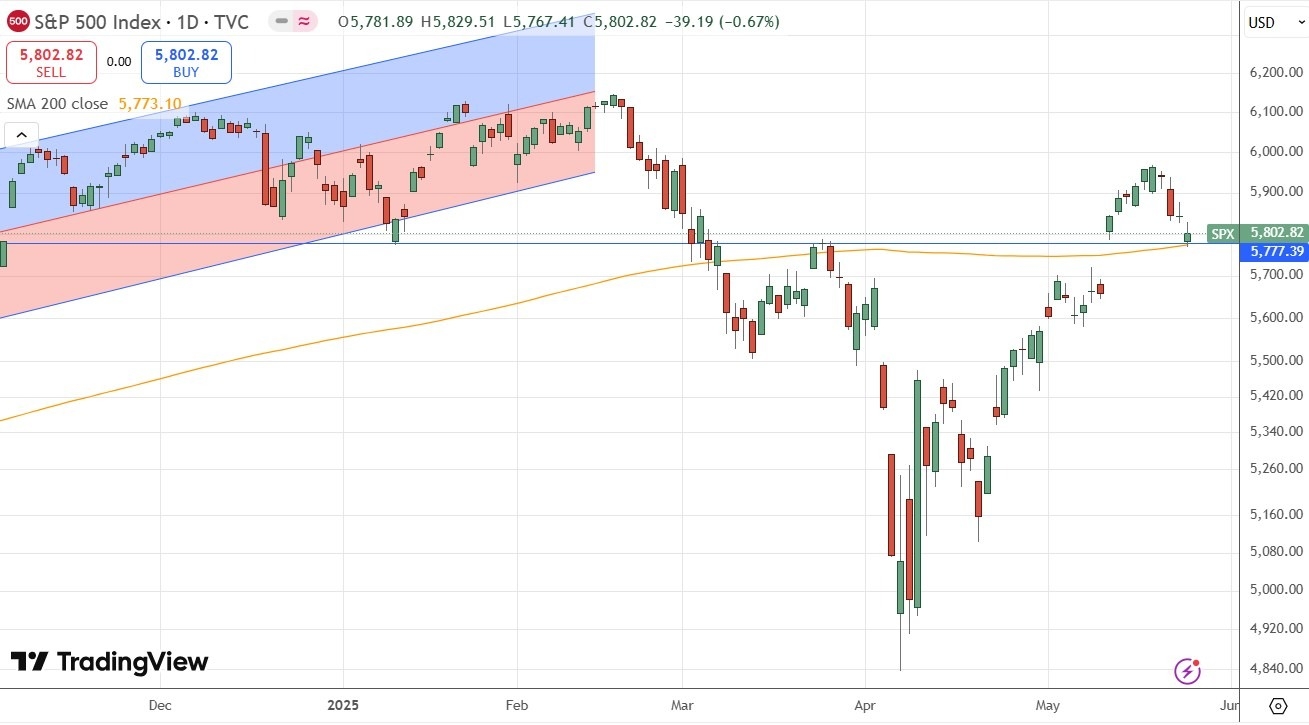
The S&P 500 Index fell last week as risk sentiment deteriorated, with the price ending the week looking a bit heavy on the support level at 5,777, which is also confluent with the 200-day moving average, as can be seen in the daily chart below.
President Trump’s new threat of a 50% tariff on imports from the European Union, along with the fact that his tax bill is running into serious difficulty in passing through Congress, have seen stocks softer in recent days.
The outlook is more bearish. I would be very happy to go long of this Index in the unlikely event that we get a daily close above the 6,142 mark. However, it may be that this level at 5,777 is very pivotal, so it might be traded either long or short depending upon the price action that happens here as the new week gets underway.
(Click on image to enlarge)
Bitcoin
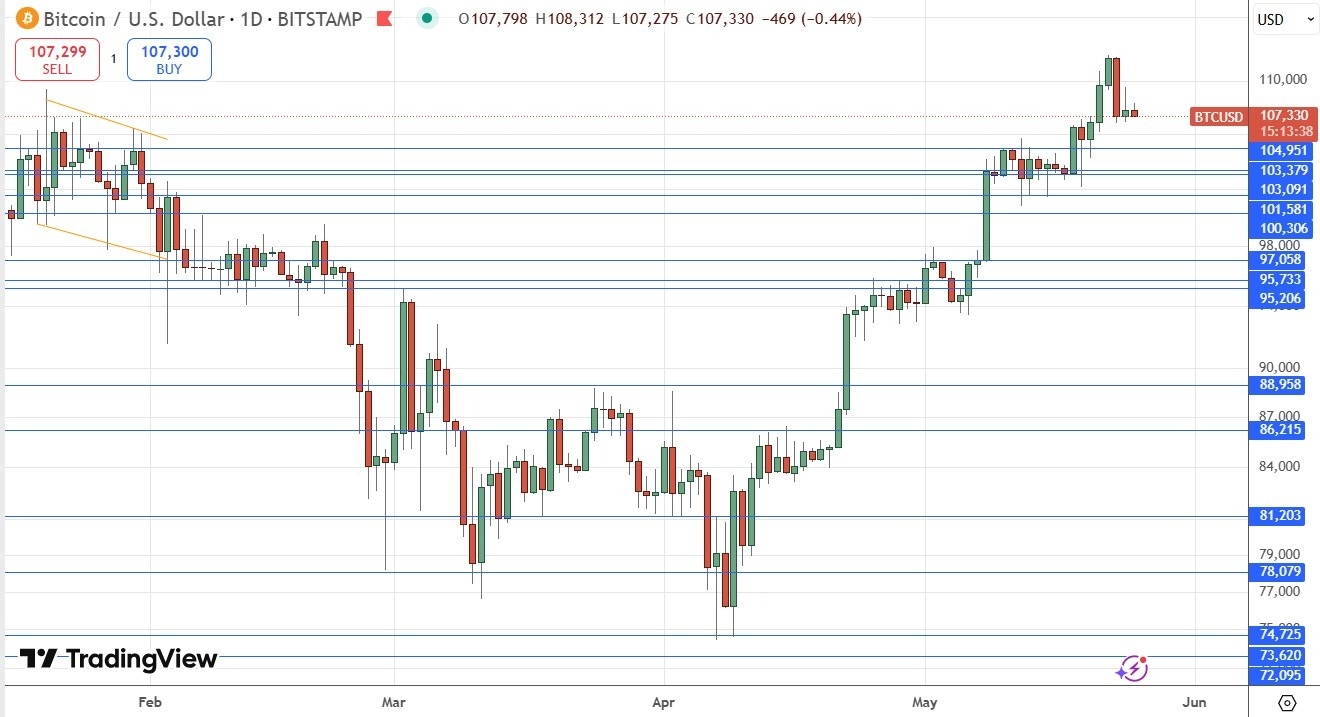
Bitcoin made a powerful bullish breakout on Tuesday to a new all-time high, and it quickly reached a climax at the $112,000 mark before falling quite sharply. On Sunday, the price was trading barely above the $107,000 level. However, this is a retracement of only about 1.5 daily ATRs, so the bullish trend is intact and plenty of trend traders will still want to be involved here on the long side.
Despite this bullish outlook, it is worth nothing that the highest daily closing price should ideally still be exceeded before entering a new long trade here, and that is further ahead at the $111,743 mark. Some traders will want to be even more cautious and wait for a new absolute high to be made above the more significant, round number above that at $112,000.
It is hard to say why Bitcoin spiked higher; the Trump Presidency just seems to generate faith in crypto bulls. I would enter a new long trade if we get a daily (New York) close above the $111,743 level this week.
(Click on image to enlarge)
GBP/USD
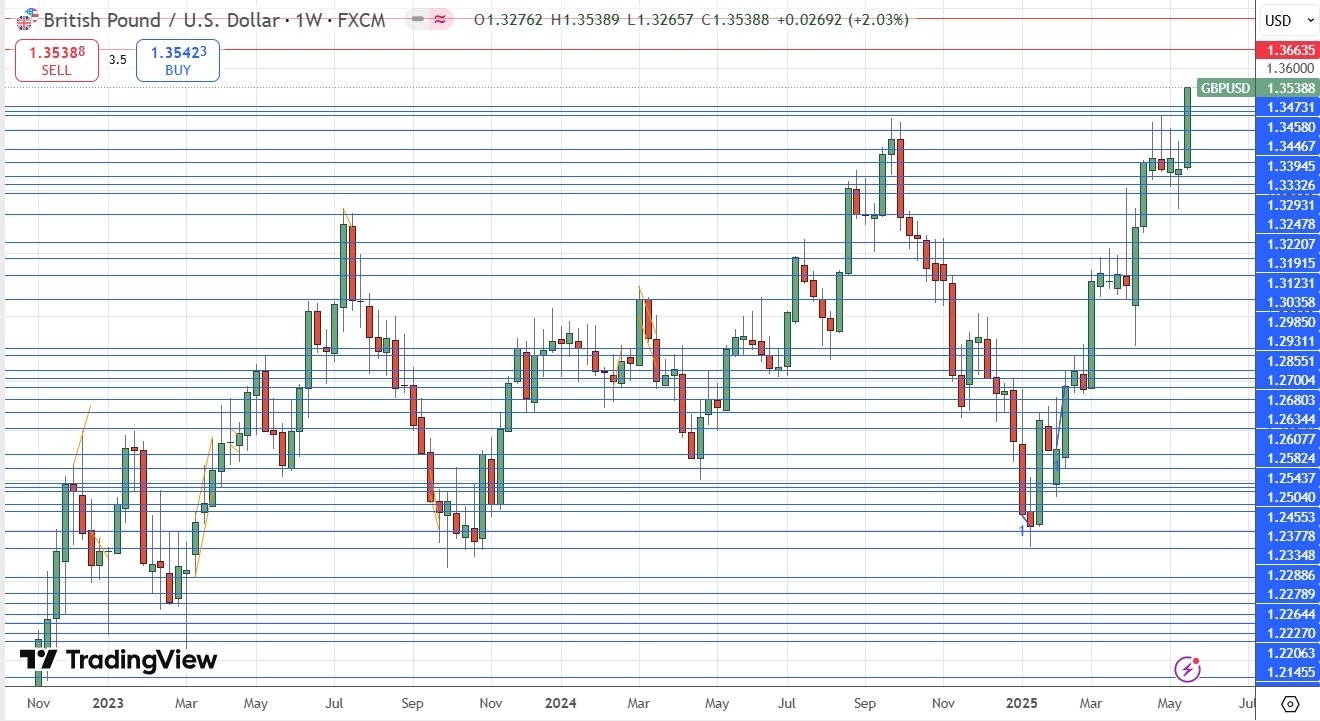
The GBP/USD currency pair was consolidating just below the multi-year high below $1.3500 before suddenly making a strong bullish breakout on Friday to a new four-year high price well above $1.3500.
There are no bearish signs to be seen, and the fact that the price closed right on the weekly high is another sign of strong bullish momentum.
The British pound has been one of the stronger major currencies for a while, which increases its bullish credibility. This is partly because inflation in the UK rose significantly last week, as the annualized CPI unexpectedly climbed from 2.6% to 3.5%, making the relatively high interest rate of 4.25% likely to persist.
I am happy to be long of this currency pair right now.
(Click on image to enlarge)
USD/ZAR
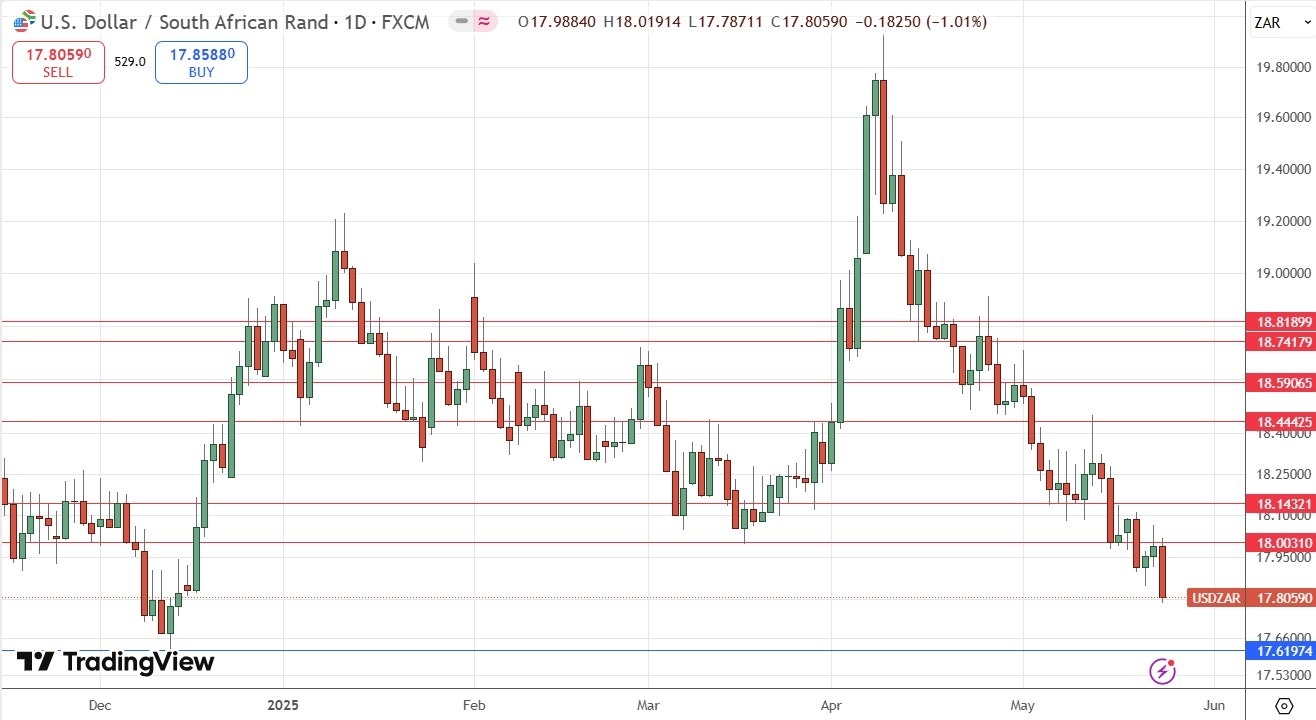
The USD/ZAR currency pair now looks heavy after it broke below the 17.98 mark earlier in the week and fell to a new five-month low, as it targeted the support level at 17.62. I wrote last week that this could be a wise short trade, and I was correct.
With so much bearish momentum proven by the price closing right on the low, I have no reason to change my mind, and so I still see this as likely to be a good short trade with a profit target at the 17.62 level.
There are reasons (such as the trade war) for some weakness in the US dollar, but the strength in the South African rand is harder to explain. Many analysts may point to relatively high and strong gold prices, with South Africa getting pulled along as a major gold producer. I suspect there is another factor, however, which is that the South African President would not have been invited to meet Trump at the White House if there wasn’t some deal being made that could put South Africa’s terms of trade in a better place, despite whatever the hostile headlines are saying.
I see this currency pair as a good short trade right now.
(Click on image to enlarge)
Bottom Line
I see the best trades this week as the following:
- Long of Bitcoin following a daily (New York) close above $111,743.
- Long of the GBP/USD currency pair.
- Short of the USD/ZAR currency pair.
More By This Author:
Forex Today: Bitcoin Power To New Record Above $111,000 HighForex Today: Bitcoin Looks To Be Heading To New All-Time High Price
Weekly Forex Forecast - Sunday, May 18
Risk Disclaimer: DailyForex will not be held liable for any loss or damage resulting from reliance on the information contained within this website including market news, analysis, trading signals ...
more


