
New OECD Weekly Tracker index(Woloszko/OECD) is out. Here’s the resulting picture:
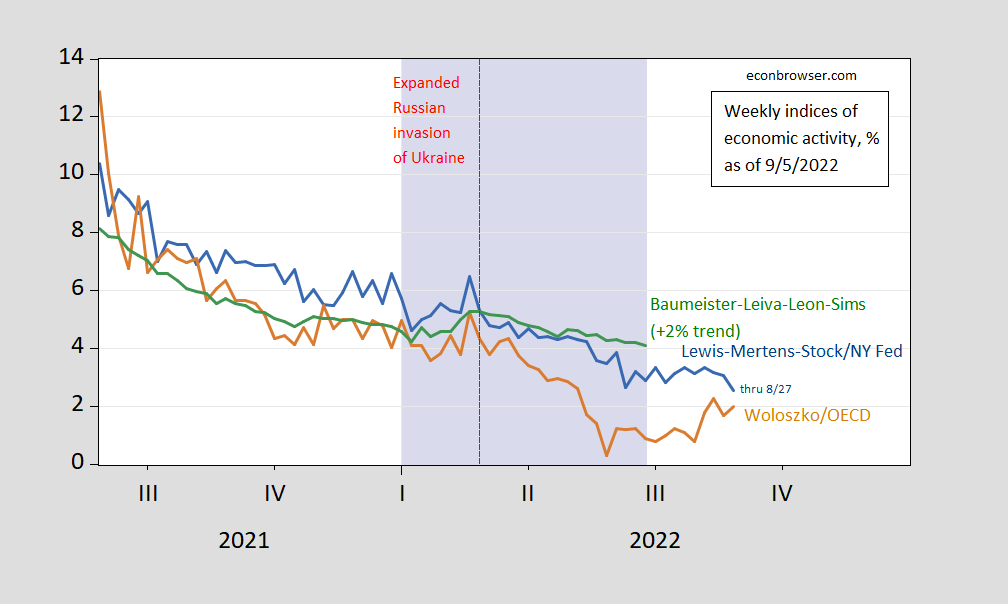
Figure 1: Lewis-Mertens-Stock Weekly Economic Index (blue), OECD Weekly Tracker (tan), Baumeister-Leiva-Leon-Sims Weekly Economic Conditions Index for US plus 2% trend (green) Lilac shading denotes a hypothetical H1 recession dates. Source: NY Fed via FRED, OECD, WECI, and author’s calculations.
The WEI reading for the week ending 8/27 of 2.5 is interpretable as a y/y quarter growth of 2.5% if the 2.5 reading were to persist for an entire quarter. The OECD Weekly Tracker reading of 2.0 is interpretable as a y/y growth rate of 2.0% for year ending 8/27 (note the previous tracker reading for 8/20 has been revised down by nearly a percentage point). The Baumeister et al. reading of 2.1% for the week ending 6/25 is interpreted as a 2.1% growth rate in excess of long term trend growth rate. Average growth of US GDP over the 2000-19 period is about 2%.
More By This Author:
Forecasting Real Activity Using Cross-sectoral Stock Market InformationFour Pictures Of The Labor Market In August
When Lacking Policy Proposals, Attack Diversity


Comments
Log in or sign up to join the conversation.