
VIX Continues To Test Support As The NQ Leads
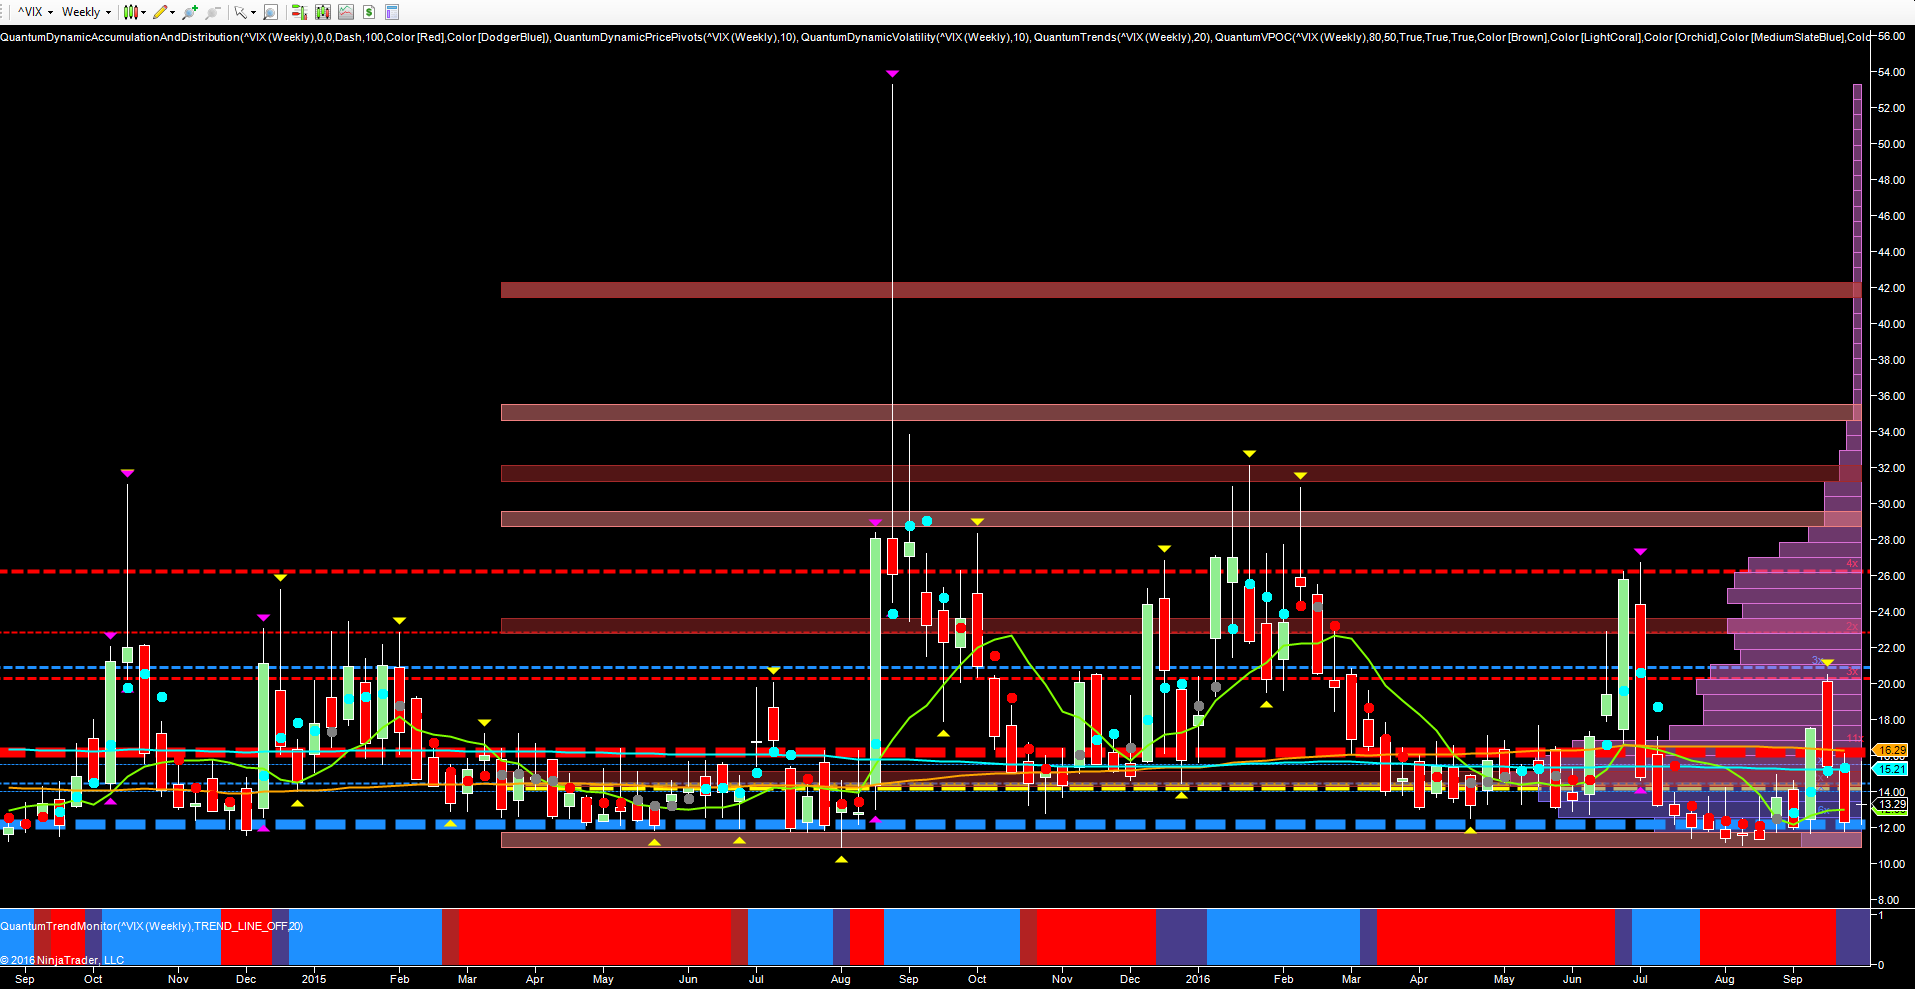
Last week was another where the strong platform of support below the 12 region for the VIX remained unbroken as the index closed at 13.29 following indecisive price action for major US markets. This area of support has been building for many years and indeed on the weekly chart here we can see it extends back well into 2014, and clearly defined with the heavy blue dotted line of the accumulation and distribution indicator. Each test of this price region has been duly repulsed with last week’s effort adding to the long list of failures, and with the US presidential election now in full swing we are likely to see yet more febrile price action from equity markets as we move to the conclusion. Needless to say, if this region is taken out, and it is a big if, with a move towards 10.50 or below, this will then signal the resumption of a longer term bullish trend for US markets.
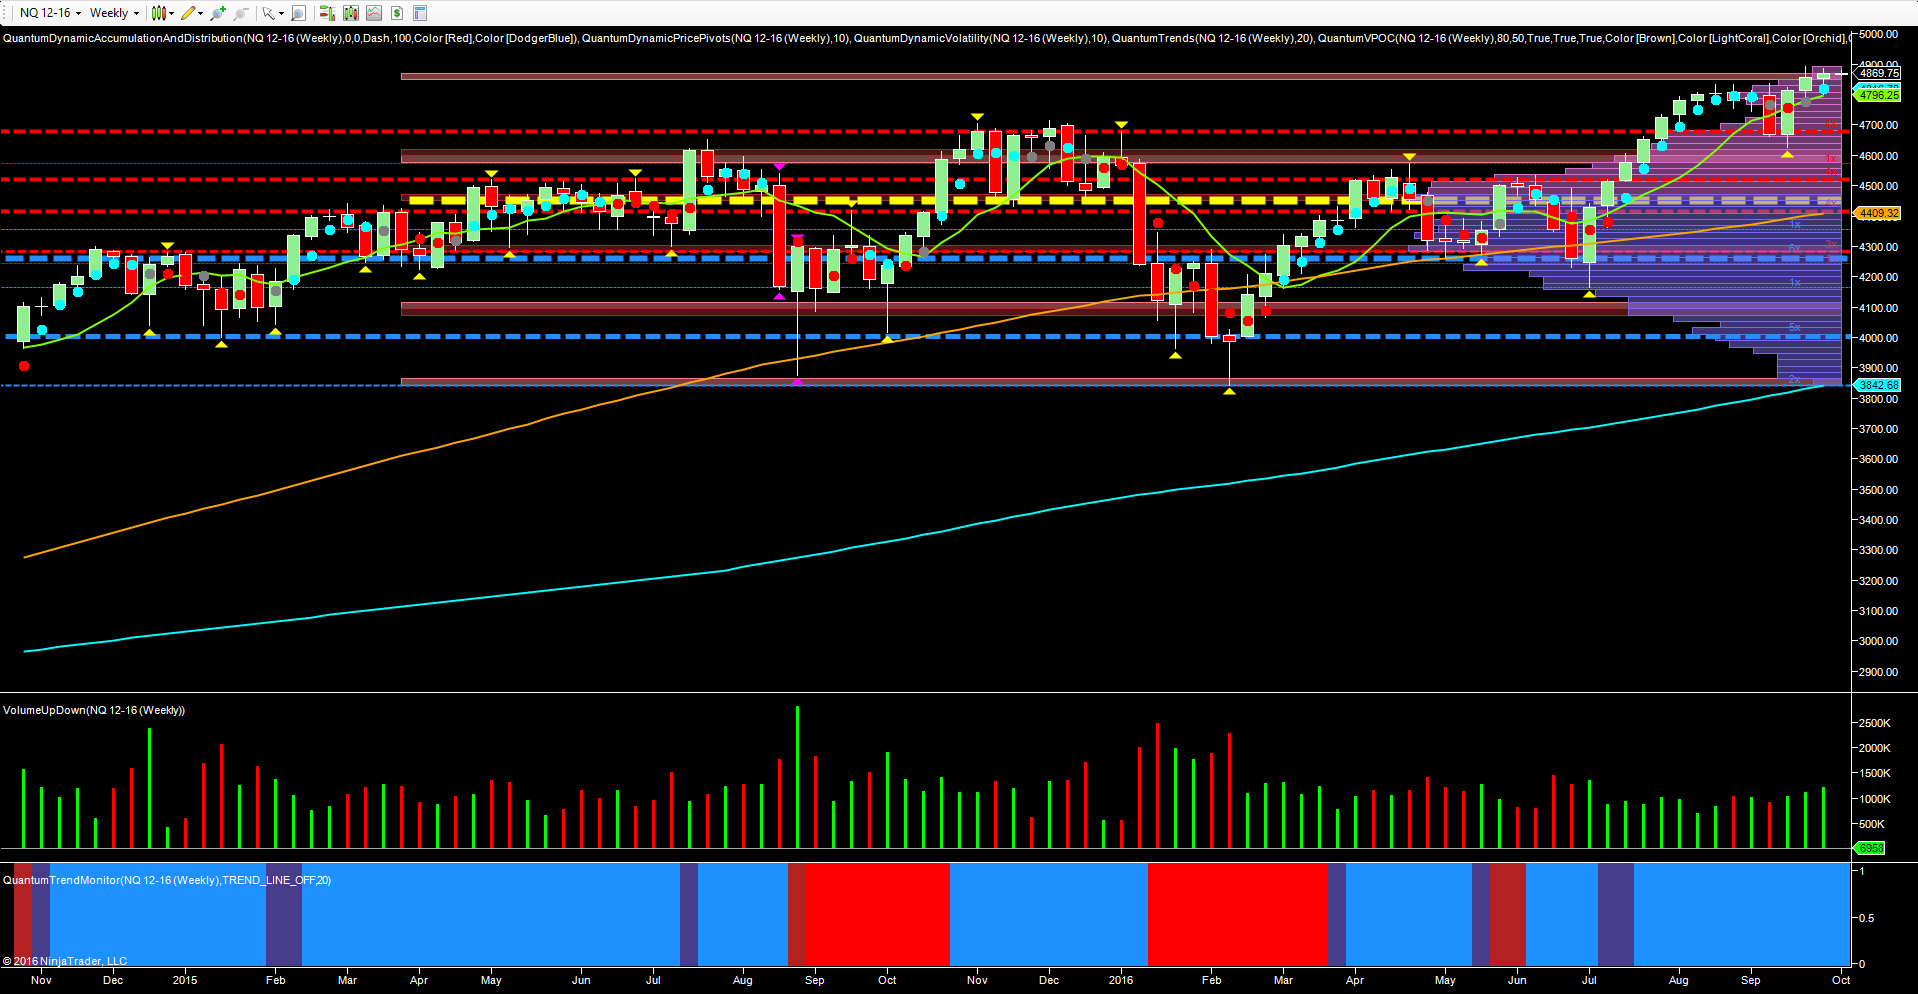
This certainly seems to be the sentiment expressed on the NQ which continues to lead the way in the same timeframe, and closing well above the support platform below in the 4796 area, and ending last week on gently rising volume and looking to test the 4900 price point in due course. The trend monitor continue ro remain firmly bullish and with the volume point of control anchored below in the 4420 area, this confirms the longer term positive outlook for equities as we move ever close to the main event….the Santa Claus rally!
Disclaimer: Futures, stocks, and spot currency trading have large potential rewards, but also large potential risk. You must be aware of the risks and be willing to accept them in order to invest in ...
more

