Visualizing The Robustness Of The US Equity ETF Market

Market commentators sometimes suggest that the equity ETF market is just a bunch of “index funds” that all do essentially the same thing: deliver undifferentiated stock market exposure.
How true is that statement? Fortunately, we can test the hypothesis that the ETF market is roughly a few thousand different ways to capture the same basic risk/returns. To do so, we leverage our Portfolio Architect tool to quantify the active share of all US equity ETFs against the S&P 500 index (the king of indexes).
Active share is the percentage of a portfolio’s stock holdings that differ from its benchmark index (in this case, the S&P 500). The measure is based on the weightings of securities in a portfolio compared with those of its benchmark and can be used as a measure of the degree of a portfolio’s active management. An active share of 0, would imply there is a 0% difference between a given ETF and the SP500. An active share of 100 would imply there is a 100% difference in holdings/weights between a given ETF and the SP500. And then you have everything in between.
As a general rule of thumb, we consider any strategy with an active share of less than 30% to be a ‘closet index’, which refers to a strategy that is effectively the same as the underlying index it seeks to track.
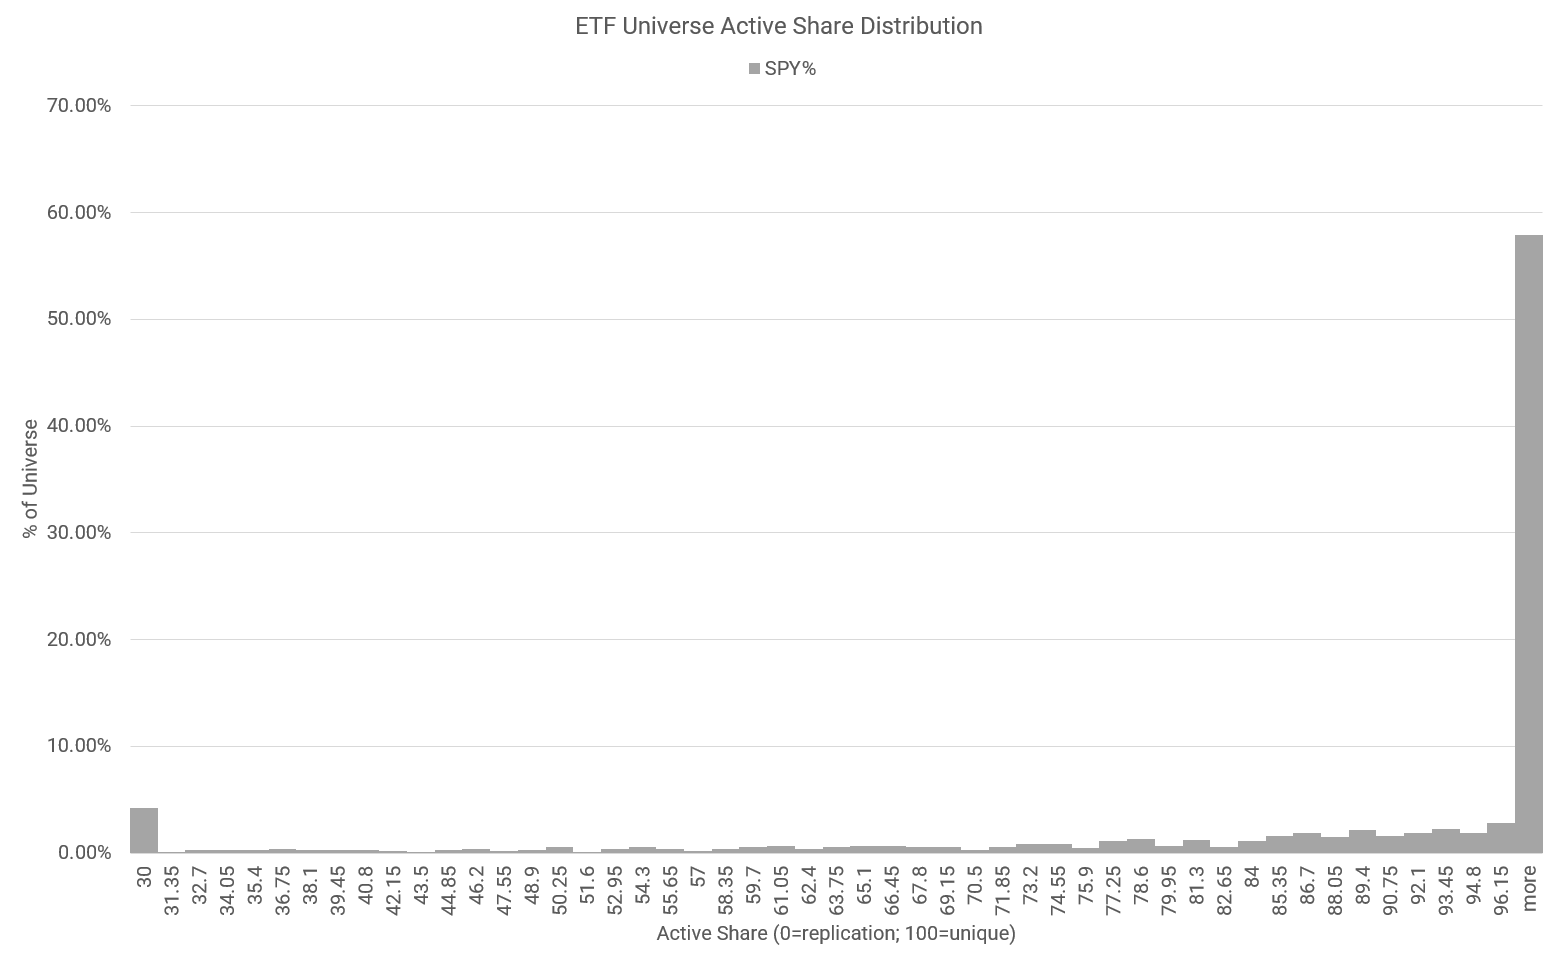
Here is the distribution of active shares across the 1814 US equity ETFs we track in our database against SPY (what we use as the SP500 holdings benchmark).

Source: Portfolio Architect
Key Points:
- A bit over 4% of all funds are S&P 500 closet-trackers. That’s a lot of clones — no doubt!
- Nearly 60% of all funds have nothing to do with the S&P 500.
- There is a lot of differentiation in the ETF market. And that’s healthy!
Performance figures contained herein are hypothetical, unaudited and prepared by Alpha Architect, LLC; hypothetical results are intended for illustrative purposes only. Past performance is not ...
more


