
The USD/JPY struggles at the 200-day Exponential Moving Average (EMA) around 134.82, dropping beneath the 134.00 mark, after US economic data, although positive, weighed on the US Dollar, exacerbating a fall of 100 pips in the major. At the time of writing, the USD/JPY is trading at 132.81, below its opening price by 0.44%.
The US Department of Labor revealed that Nonfarm Payrolls in December increased by 223K, above estimates of 200K, data showed on Friday. The Unemployment Rate fell to 3.5% YoY, against estimates of 3.7%, while Average hourly earnings rose 4.6%, below the market consensus of 5.0%, welcomed news for Fed officials, who see wage pressures as a hurdle to tackle inflation.
The Wall Street Journal (WSJ) Fed Watcher Nick Timiraos Tweeted that “revisions to average hourly earnings data paint a marginally less worrisome picture for the Fed on wages than the Nov report.”
The US Dollar Index, which measures the buck’s value against a basket of rivals, tumbled below the 105.000 mark, spurred by that Timiraous Tweet, at 104.963. Nevertheless, it recovered some ground, above 105.000 before reversing its trend, and turned negative at around 104.682, down by 0.46%.
Meanwhile, US Treasury bond yields edged lower by nine bps, down at 3.625%, a headwind for the USD/JPY, which is diving from daily highs reached at 134.77.
Of late, Atlanta’s Fed President Raphael Bostic is crossing newswires. He said that December’s labor market data does not change his outlook on the economy, adding that the Fed needs to stay the course as inflation remains too high. Bostic's base case for the Federal Funds rate (FFR) is to hit the 5.00-5.25% range, and to stay at that level, well into 2024.
USD/JPY Price Analysis: Technical outlook
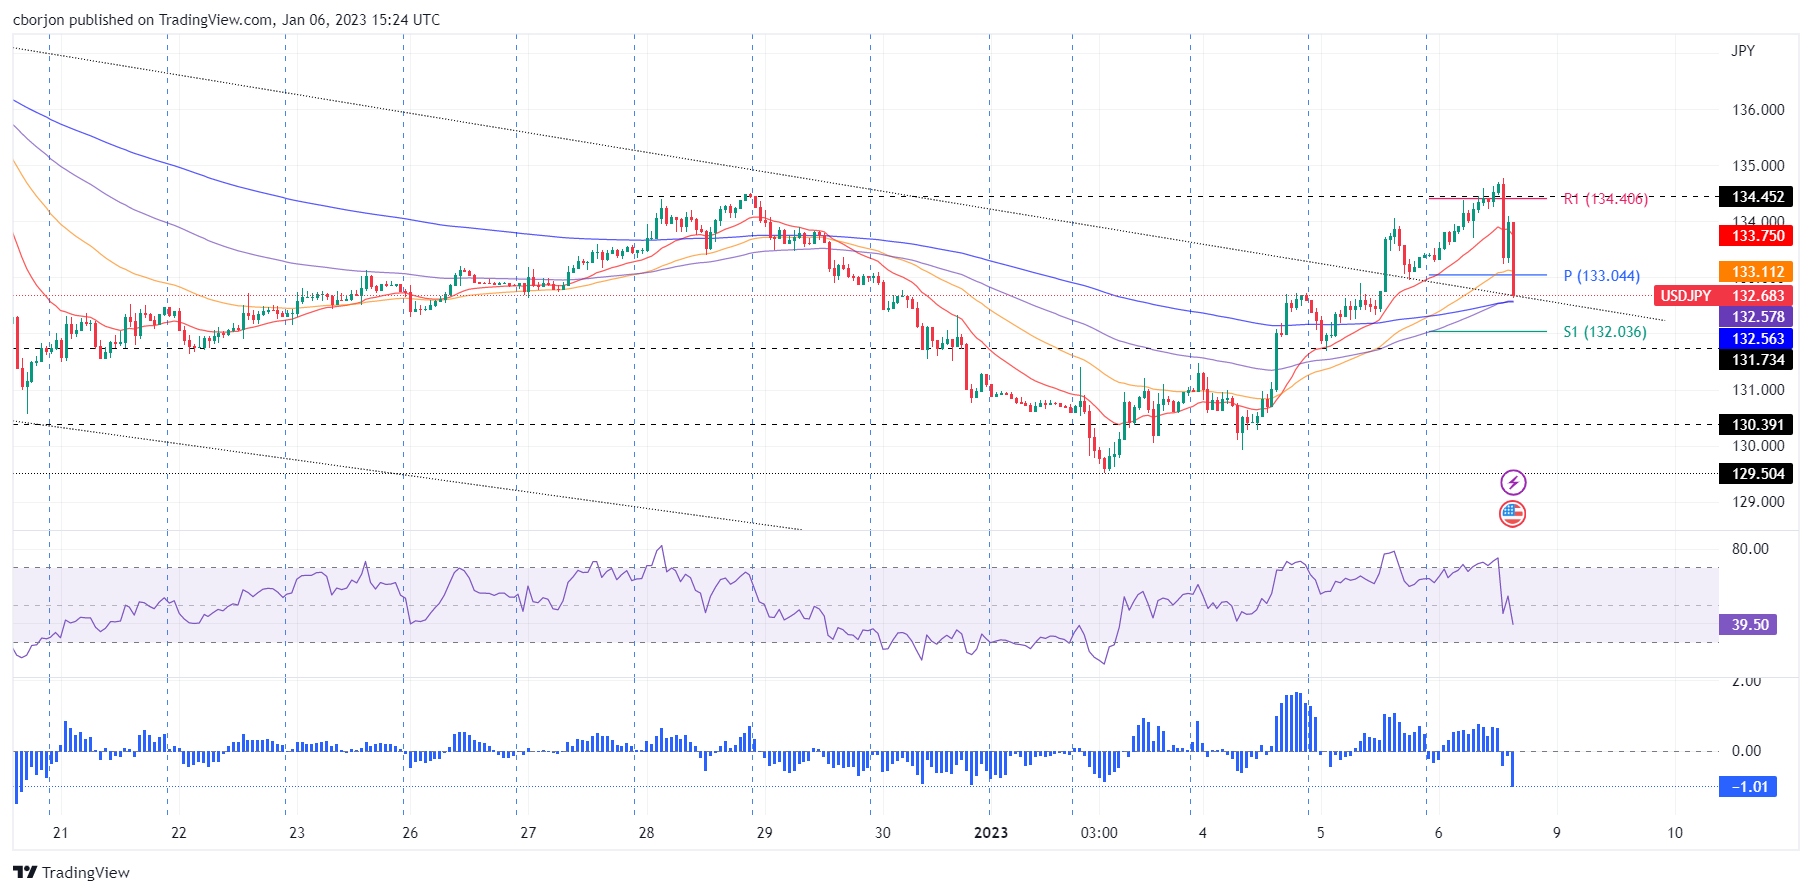
In the short term, the USD/JPY hourly chart flashes the US Dollar continues to weaken, extending its gains beneath the daily pivot point at 133.04. On its way down, the USD/JPY cleared the 20 and 50-EMAs, though a downslope trendline and the confluence of the 100 and 200-EMAs around 132.55/57 might stall the fall, shy of the S1 daily pivot at 132.03. On the flip side, if the USD/JPY reclaims 133.00, that could open the door for a resumption of the uptrend, exposing resistance levels like the 134.00 mark, followed by the R1 daily pivot point at 134.45.
(Click on image to enlarge)
USD/JPY
| OVERVIEW | |
|---|---|
| Today last price | 133 |
| Today Daily Change | -0.36 |
| Today Daily Change % | -0.27 |
| Today daily open | 133.36 |
| TRENDS | |
|---|---|
| Daily SMA20 | 133.95 |
| Daily SMA50 | 138.33 |
| Daily SMA100 | 140.99 |
| Daily SMA200 | 136.41 |
| LEVELS | |
|---|---|
| Previous Daily High | 134.06 |
| Previous Daily Low | 131.68 |
| Previous Weekly High | 134.5 |
| Previous Weekly Low | 130.78 |
| Previous Monthly High | 138.18 |
| Previous Monthly Low | 130.57 |
| Daily Fibonacci 38.2% | 133.15 |
| Daily Fibonacci 61.8% | 132.59 |
| Daily Pivot Point S1 | 132.01 |
| Daily Pivot Point S2 | 130.66 |
| Daily Pivot Point S3 | 129.64 |
| Daily Pivot Point R1 | 134.39 |
| Daily Pivot Point R2 | 135.41 |
| Daily Pivot Point R3 | 136.76 |
More By This Author:
Singapore: High Street Seems To Be Losing Momentum – UOB
EUR/USD Breaks Above 1.0600 On US Dollar Sell-Off After Weak ISM
Silver Price Forecast: XAG/USD Tanks Toward $23.20s Ahead Of U.S. Nonfarm Payrolls


Comments
Log in or sign up to join the conversation.