
The USD/CAD pared back above 1.3260 after plunging to a fresh 19-week low on Friday as markets continue to price in an accelerated pace of rate cuts from the Federal Reserve (Fed) in 2024 as US inflation continues to ease faster than initially expected.
Canadian GDP stalls out, US inflation continues to recede
The Canadian Dollar is struggling to find reasons to catch bids as economic data from Canada continues to point towards an economic slowdown. Canadian monthly Gross Domestic Product (GDP) failed to print growth for a fourth straight reporting period in October, coming in flat at 0.0% after September’s GDP print saw a downside revision from a meager 0.1% to flat. Canadian GDP has failed to move the needle month-over-month since June’s 0.2% decline.
The US Personal Consumption Expenditures (PCE) Price Index eased back from market forecasts as inflation continues to drain away faster than economic models predicted, ramping up money market bets of faster and more frequent rate hikes from the Fed in 2024. The Core US PCE Price Index for the year through November printed at 3.2% versus the market forecast of 3.3%, slipping back from October’s print of 3.4% (revised down from 3.5%).
With US inflation steadily declining, investors’ bets on Fed rate cuts next year have ramped up significantly with market expectations running well ahead of the Fed’s own rate outlook; money markets are pricing in upwards of 160 basis points in rate cuts through 2024, compared to the Fed’s own dot plot of rate forecasts, which sees only 75 basis points by the end of next December.
USD/CAD Technical Outlook
The USD/CAD’s late-Friday rally has the pair pulling back into neutral territory on the day, clawing back towards the 1.3300 handle as market volatility takes a step higher heading into the week’s close.
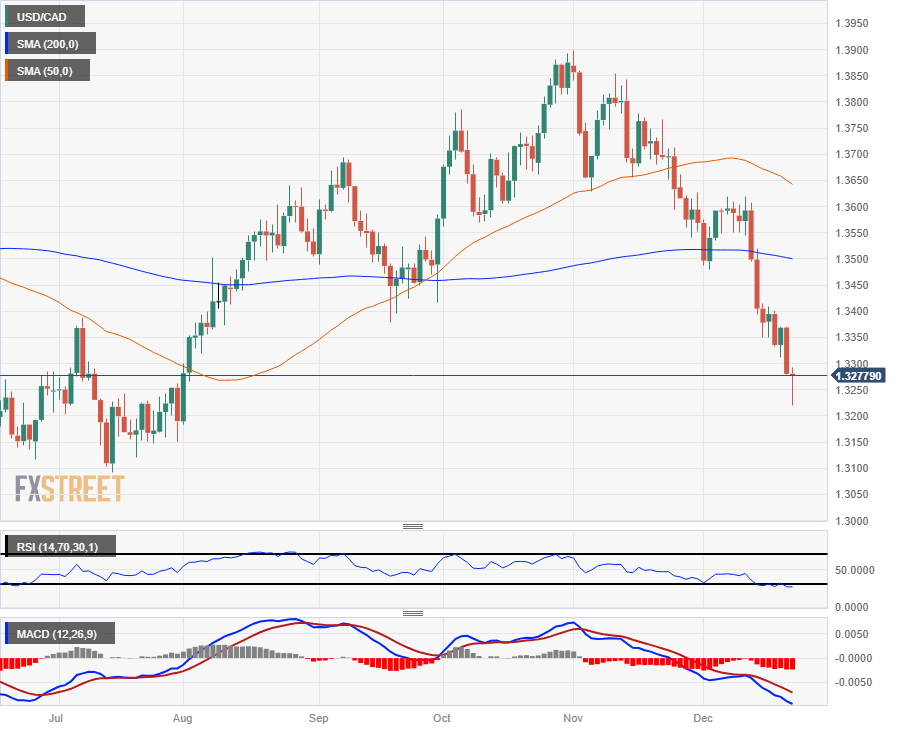
The pair is still down on the week, down eight-tenths of one percent from Monday’s opening bids and in the red by 2.5% from the last swing high into 1.3620.
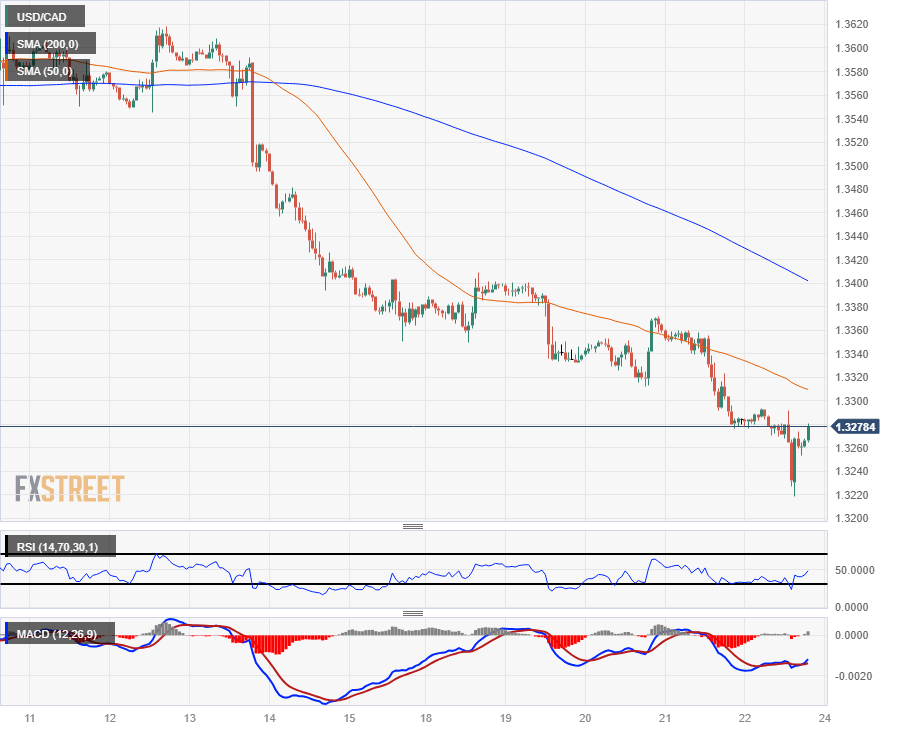
Intraday action still has a lot of ground to cover before the pair can start challenging topside momentum beyond the 200-hour Simple Moving Average (SMA) near 1.3400, and near-term recoveries will be difficult to time with technical indicators pinned into oversold territory.
USD/CAD Hourly Chart
(Click on image to enlarge)
USD/CAD Daily Chart
(Click on image to enlarge)
USD/CAD Technical Levels
USD/CAD
| OVERVIEW | |
|---|---|
| Today last price | 1.3276 |
| Today Daily Change | -0.0004 |
| Today Daily Change % | -0.03 |
| Today daily open | 1.328 |
| TRENDS | |
|---|---|
| Daily SMA20 | 1.3511 |
| Daily SMA50 | 1.365 |
| Daily SMA100 | 1.3599 |
| Daily SMA200 | 1.3502 |
| LEVELS | |
|---|---|
| Previous Daily High | 1.3371 |
| Previous Daily Low | 1.328 |
| Previous Weekly High | 1.3619 |
| Previous Weekly Low | 1.335 |
| Previous Monthly High | 1.3899 |
| Previous Monthly Low | 1.3541 |
| Daily Fibonacci 38.2% | 1.3315 |
| Daily Fibonacci 61.8% | 1.3336 |
| Daily Pivot Point S1 | 1.325 |
| Daily Pivot Point S2 | 1.3219 |
| Daily Pivot Point S3 | 1.3158 |
| Daily Pivot Point R1 | 1.3341 |
| Daily Pivot Point R2 | 1.3402 |
| Daily Pivot Point R3 | 1.3433 |
More By This Author:
Pound Sterling Eyes More Upside On Upbeat UK Retail Sales, Soft US Core PCE Data
USD/CAD Remained Weak Below 1.3300 After Canadian, US Data
Silver Price Analysis: XAG/USD Rebounded Near Day’s High As US Core PCE Decelerated


Comments
Log in or sign up to join the conversation.