Silver Price Analysis: XAG/USD Rebounded Near Day’s High As US Core PCE Decelerated

Image Source: Pixabay
- The price of silver swiftly recovered after the softer-than-projected US core PCE inflation report.
- The underlying inflation data boosted bets regarding the Fed’s rate cuts.
- US Durable Goods Orders rose strongly by 5.4% vs. the consensus of 2.2%.
The price of silver (XAG/USD) gathered strength for more upside on Friday after the United States Bureau of Economic Analysis (BEA) released the softer-than-anticipated core Personal Consumption Expenditure (PCE) price index report for November.
Monthly US core PCE data grew slightly by 0.1% while investors projected a growth rate of 0.2% as recorded for October. On an annualized basis, the underlying inflation has decelerated to 3.2% vs. the consensus of 3.3% and the former reading of 3.5%. Investors should note that the Federal Reserve, in its Summary of Projections (SOP) released least week, forecasted core PCE at 3.2% by the year's end,
A soft US core PCE report may deepen expectations for rate cuts from the Fed further, which could keep precious metals underpinned against the US dollar. The US Dollar Index (DXY) appeared to be looking to extend its downside below four-month low of 101.50
Contrary to market expectations, Fed policymakers seem to be consistently pushing back rate cut expectations, citing restrictive interest rate policy for a longer period is highly required to ensure the achievement of price stability.
Meanwhile, US Durable Goods Orders for November remained upbeat compared to expectations. Fresh orders for core goods rose significantly by 5.4% vs. the consensus of 2.2%. In October, the economic data was contracted by 5.1%.
Silver Technical Analysis
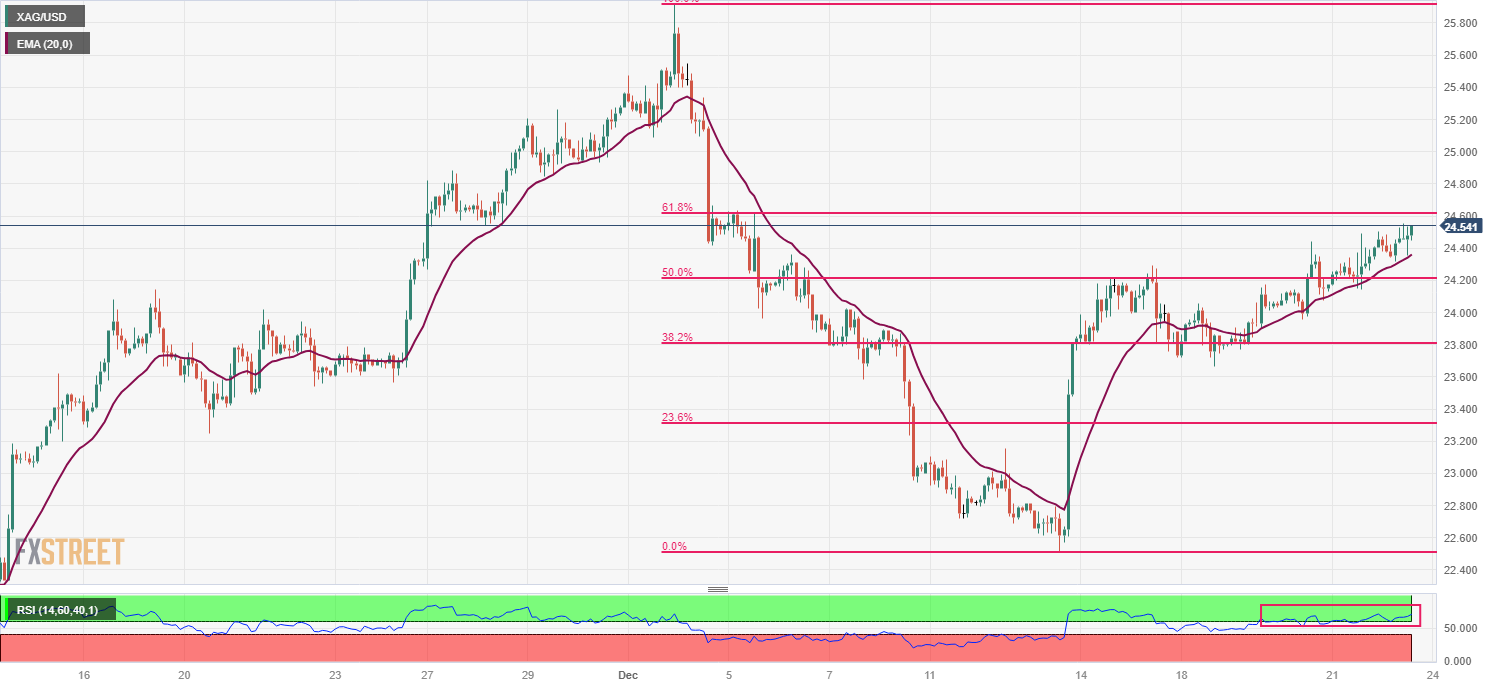
The price of silver climbed up near the 61.8% Fibonacci retracement (plotted from the Dec. 12 high at $25.90 to the Dec. 13 low around $22.60) at $22.60 on a two-hour scale. The 20-period Exponential Moving Average (EMA) at around $24.35 continued to provide support to the white metal.
The Relative Strength Index (RSI) (14) oscillated in the bullish range of 60.00-80.00, which seemed to indicate that the upside momentum was intact.
Silver Two-Hour Chart
(Click on image to enlarge)
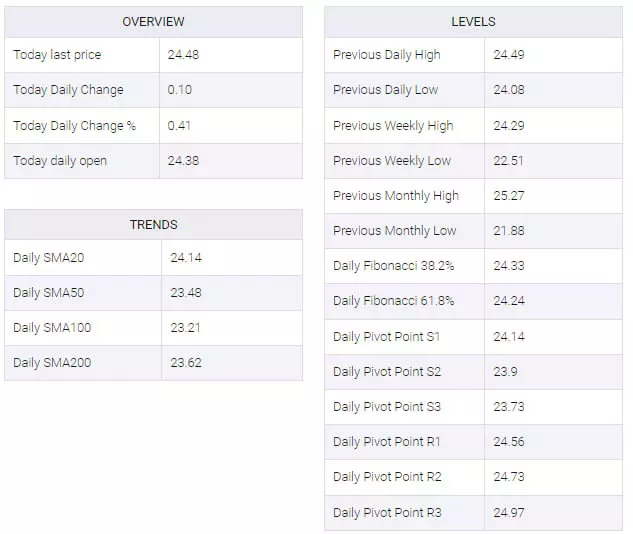
XAG/USD Technical Levels

More By This Author:
GBP/USD Holding Above 1.2700 After US PCE Inflation Keeps Rate Cut Hopes Pinned To The CeilingUSD/JPY Rebounds Into New Friday High, Aimed For 143.00
EUR/GBP Dips To The 0.8660 Area Following Mixed UK Data
Disclosure: Information on this article contains forward-looking statements that involve risks and uncertainties. Markets and instruments profiled on this page are for informational purposes ...
more


