
After a hiatus, ADP released today a new series (compiled in conjunction with the Stanford Digital Economy Lab) that tries to independently measure private nonfarm payroll employment, rather than predict the BLS series. What does it look like over time, and compared to the old series (and the BLS series)?
First , the various series over the sample we have at least two measures:
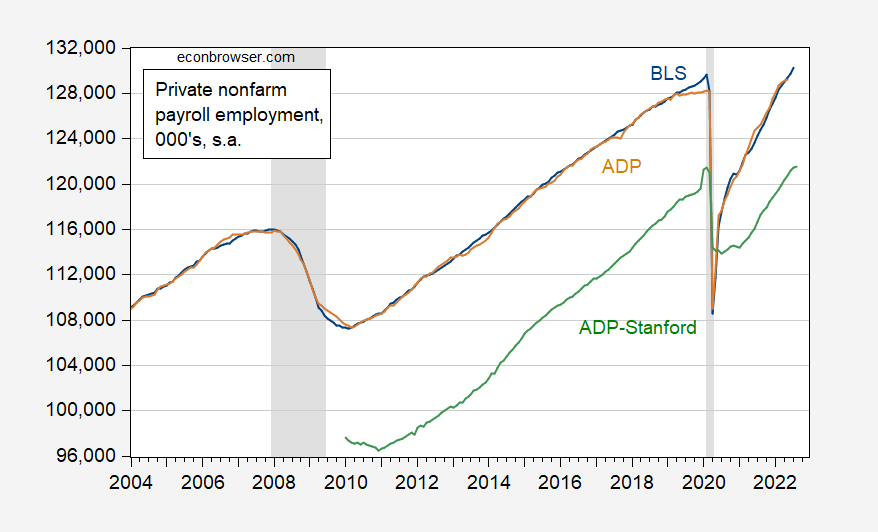
Figure 1: Private nonfarm payroll employment from BLS (blue), from ADP (tan), from ADP and Stanford Digital Economy Lab (green), all in 000’s, s.a. NBER defined peak-to-trough recession dates shaded gray. Source: BLS, ADP via FRED, ADP, and NBER.
Notice that there’s a big difference in level between the new ADP series and the BLS series, reflecting the point that the new ADP series is not aimed at predicting the BLS series (technical description here). In words:
Based on anonymized and aggregated payroll data of over 25 million U.S. employees, this independent measure will detail the current month’s non-farm private employment change and deliver weekly job data from the previous month. Data will be broken out by industry, business establishment size, and U.S. census region. Historical data from the previous 12 years at both monthly and weekly frequencies will be benchmarked and available at launch.
How do the changes in each series look? It’s hard to discern patterns in the month-on-month changes, so I show quarter-on-quarter changes (in logs) in Figure 2.

Figure 2: Three month change (not annualized) in log of private nonfarm payroll employment from BLS (blue), from ADP (tan), from ADP and Stanford Digital Economy Lab (green), s.a. NBER defined peak-to-trough recession dates shaded gray. Source: BLS, ADP via FRED, ADP, NBER, and author’s calculations.
Over the 2010-22M05 period, the adjusted R2 for a regression between the old ADP series and the BLS series was about 0.98, and and new ADP series and the BLS series about 0.78. A lot of this high correlation was due to the 2020 recession. Omitting the 2020M03-2020M12 period, the corresponding R2 was 0.42 and 0.13, respectively. For the 2021M01-22M05 period, the adjusted R2 was 0.01 and -0.03, respectively. In other words, to infer what is happening to the BLS measure from the ADP measure was was unwise even with the previous series.
Hence, in response to the relatively small increase (132K), Goldman Sachs left unchanged their forecast (of +325K).
Here’s a closer look at the recent history of the series, along with the Bloomberg consensus as of today.

Figure 3: Private nonfarm payroll employment from BLS (blue), from ADP (tan), from ADP and Stanford Digital Economy Lab (green), Bloomberg consensus as of 8/30, assuming no revision in July figure (sky blue square), all in 000’s, s.a. NBER defined peak-to-trough recession dates shaded gray. Source: BLS, ADP via FRED, ADP, Bloomberg (accessed 8/30) , NBER, and author’s calculations.
While the revamped ADP series might not tell us much about what the BLS series on private nonfarm payroll will be, it still tells us that for the companies that ADP covers, growth in employment has slowed. The ADP data can also inform us on what firms are increasing their payroll, and how wages are changing (see the release).
More By This Author:
Is The Dollar Strong? Or Likely To Get Stronger?Weekly Economic Indicators, Thru Aug. 20
Bank Lending, Thru Aug. 17


Comments
Log in or sign up to join the conversation.