US Dollar Rallies Further On President Putin’s Warning, Fed Decision In View
The US dollar hit levels last seen two decades ago in early European trade as the greenback rallied after Russian President Vladimir Putin announced a partial military mobilization, ramping up fears of a further escalation of military action in Ukraine. Worryingly, President Putin warned that he was not ‘bluffing’ about the use of nuclear weapons in response to what he sees as Western aggression. Putin’s comments while ramping up fears may also indicate that the Russian President is worried about how the war in Ukraine is going with some seeing his mobilization of up to 300,000 reservists as a sign that Russia’s army in Ukraine has been severely depleted.
The latest escalation in the Russia/Ukraine conflict has taken the limelight off tonight’s FOMC monetary policy decision, but not for long. The Fed is fully expected to hike rates by 75 basis points this evening, with an outside chance of a super-sized 100bp hike, while chair Powell’s subsequent commentary and the quarterly Summary of Economic Projections (SEP) will be parsed closely for any clues about the future path of US monetary policy.
You can follow the Federal Reserve’s decision, and market implications, live on the link below.
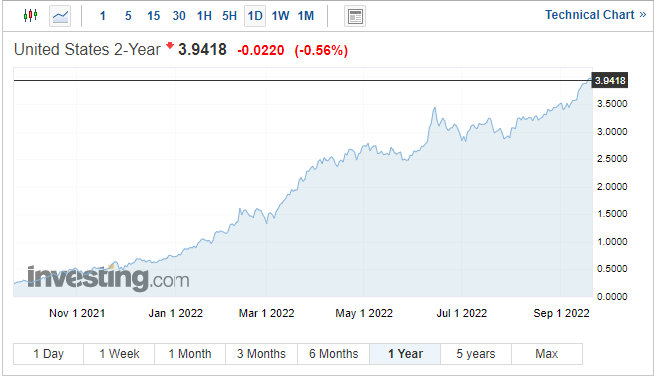
Russia’s aggression in Ukraine saw buyers flock to the safe-haven US dollar today, boosting the value of the greenback further. The US dollar has been pushed higher over the last few months by rising US treasury yields and increased expectations that the Fed will go hard in its fight against inflation, even at the expense of triggering a short-term recession. Interest-rate sensitive UST 2-year yields are currently at a 15-year high just under 4%, up from around 28 basis points a year ago.
(Click on image to enlarge)

For all market moving data releases and economic events see the real-time DailyFX Calendar.
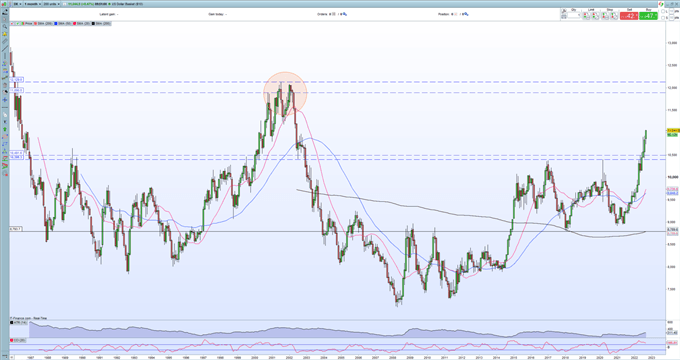
Looking at the latest, monthly DXY chart, there is very little in the way of technical resistance to stop the US dollar from pushing even higher. The only point of note on the monthly chart is a cluster of old highs made between October 2000 and January 2002 that top out at 121.29. That may seem a stretch from a current level of just over 111.00 but there’s nothing in the way. The monthly chart is flashing a heavily overbought signal and this may need to be washed out before the greenback moves higher.
US DOLLAR (DXY) DAILY PRICE CHART – SEPTEMBER 21, 2022
(Click on image to enlarge)

More By This Author:
British Pound Forecast: GBP/USD Slumps To A 37-Year Low Ahead Of The BoE
Euro Forecast – Punchy Fed Rate Hike Will Force EUR/USD Ever Lower
US Dollar (DXY) On The Back Foot, Bruised By The ECB And BoJ
Disclosure: See the full disclosure for DailyFX here.


